.plot_options
.abands.accessibility.ad.arcdiagram.area.aroon.atr.averages.bar.base.bellcurve.boxplot.bubble.bullet.candlestick.data_sorting.dependencywheel.disparity_index.dmi.drag_drop.dumbbell.flags.funnel.gantt.gauge.generic.heatmap.histogram.hlc.indicators.item.levels.linear_regressions.link.momentum.networkgraph.organization.oscillators.packedbubble.pareto.pictorial.pie.pivot_points.points.polygon.price_envelopes.psar.pyramid.sankey.scatter.series.sonification.spline.sunburst.timeline.treegraph.treemap.vbp.vector.venn.wordcloud.zigzag
class: PlotOptions
- class PlotOptions(**kwargs)[source]
A wrapper object for configurations applied to each series type.
The config objects for each series can also be overridden for each series item as given in the series array.
Configuration options for the series are given in three levels:
Options for all series in a chart are given in the
seriesproperty.Options for all series of a specific type are given in the corresponding property for that type, for example
plot_options.line.Finally, options for one single series are given in the
Options.seriesarray.
Class Inheritance
- copy(other=None, overwrite=True, **kwargs)
Copy the configuration settings from this instance to the
otherinstance.- Parameters:
other (
HighchartsMeta) – The target instance to which the properties of this instance should be copied. IfNone, will create a new instance and populate it with properties copied fromself. Defaults toNone.overwrite (
bool) – ifTrue, properties inotherthat are already set will be overwritten by their counterparts inself. Defaults toTrue.kwargs – Additional keyword arguments. Some special descendents of
HighchartsMetamay have special implementations of this method which rely on additional keyword arguments.
- Returns:
A mutated version of
otherwith new property values
- classmethod from_dict(as_dict: dict, allow_snake_case: bool = True)
Construct an instance of the class from a
dictobject.
- classmethod from_js_literal(as_str_or_file, allow_snake_case: bool = True, _break_loop_on_failure: bool = False)
Return a Python object representation of a Highcharts JavaScript object literal.
- Parameters:
as_str_or_file (
str) – The JavaScript object literal, represented either as astror as a filename which contains the JS object literal.allow_snake_case (
bool) – IfTrue, interpretssnake_casekeys as equivalent tocamelCasekeys. Defaults toTrue._break_loop_on_failure (
bool) – IfTrue, will break any looping operations in the event of a failure. Otherwise, will attempt to repair the failure. Defaults toFalse.
- Returns:
A Python object representation of the Highcharts JavaScript object literal.
- Return type:
HighchartsMeta
- classmethod from_json(as_json_or_file, allow_snake_case: bool = True)
Construct an instance of the class from a JSON string.
- Parameters:
as_json_or_file – The JSON string for the object or the filename of a file that contains the JSON string.
allow_snake_case (
bool) – IfTrue, interpretssnake_casekeys as equivalent tocamelCasekeys. Defaults toTrue.
- Returns:
A Python objcet representation of
as_json.- Return type:
HighchartsMeta
- get_required_modules(include_extension=False) List[str]
Return the list of URLs from which the Highcharts JavaScript modules needed to render the chart can be retrieved.
- to_dict() dict
Generate a
dictrepresentation of the object compatible with the Highcharts JavaScript library.Note
The
dictrepresentation has a property structure and naming convention that is intentionally consistent with the Highcharts JavaScript library. This is not Pythonic, but it makes managing the interplay between the two languages much, much simpler.
- to_js_literal(filename=None, encoding='utf-8', careful_validation=False) str | None
Return the object represented as a
strcontaining the JavaScript object literal.- Parameters:
along the way using the esprima-python library. Defaults to
False.Warning
Setting this value to
Truewill significantly degrade serialization performance, though it may prove useful for debugging purposes.
- to_json(filename=None, encoding='utf-8')
Generate a JSON string/byte string representation of the object compatible with the Highcharts JavaScript library.
Note
This method will either return a standard
stror abytesobject depending on the JSON serialization library you are using. For example, if your environment has orjson, the result will be abytesrepresentation of the string.- Parameters:
- Returns:
A JSON representation of the object compatible with the Highcharts library.
- Return type:
- static trim_dict(untrimmed: dict, to_json: bool = False, context: str = None) dict
Remove keys from
untrimmedwhose values areNoneand convert values that have.to_dict()methods.- Parameters:
untrimmed (
dict) – Thedictwhose values may still beNoneor Python objects.to_json (
bool) – IfTrue, will remove all keys fromuntrimmedthat are not serializable to JSON. Defaults toFalse.context (
strorNone) – If provided, will inform the method of the context in which it is being run which may inform special handling cases (e.g. where empty strings may be important / allowable). Defaults toNone.
- Returns:
Trimmed
dict- Return type:
- static trim_iterable(untrimmed, to_json=False, context: str = None)
Convert any
EnforcedNullTypevalues inuntrimmedto'null'.- Parameters:
untrimmed (iterable) – The iterable whose members may still be
Noneor Python objects.to_json (
bool) – IfTrue, will remove all members fromuntrimmedthat are not serializable to JSON. Defaults toFalse.context (
strorNone) – If provided, will inform the method of the context in which it is being run which may inform special handling cases (e.g. where empty strings may be important / allowable). Defaults toNone.
- Return type:
iterable
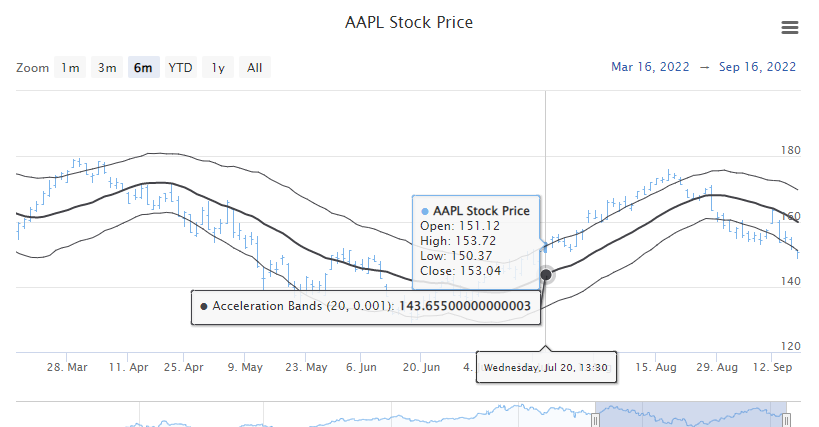
- property abands: AbandsOptions | None
Configuration for Acceleration Bands, a technical indicator which plots a trio of lines using a simple moving average for the midpoint, and the high and low values as the corresponding high and low bands.
- Return type:
AbandsOptionsorNone
- property ad: ADOptions | None
Options to configure an Accumulation/Distribution indicator, which is a cumulative indicator that uses volume and price to assess whether a stock is being accumulated or distributed
- Return type:
ADOptionsorNone
- property ao: AOOptions | None
General options to configure Awesome Oscillators, used within the financial markets to confirm or disprove trends on price charts.
- Return type:
AOOptionsorNone
- property apo: APOOptions | None
General options to configure Absolute Price Oscillators (APO), which is an oscillator that displays the difference between two exponential moving averages of an asset’s price expressed as an absolute value
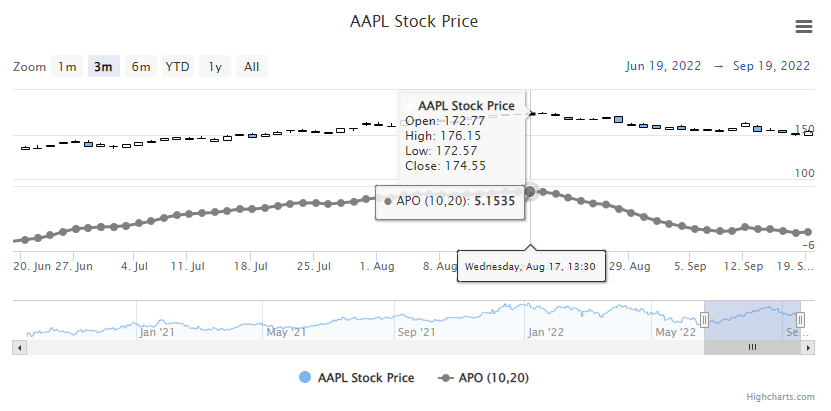
- Return type:
APOOptionsorNone
- property arcdiagram: ArcDiagramOptions | None
Arc diagram series is a chart drawing style in which the vertices of the chart are positioned along a line on the Euclidean plane and the edges are drawn as a semicircle in one of the two half-planes delimited by the line, or as smooth curves formed by sequences of semicircles.
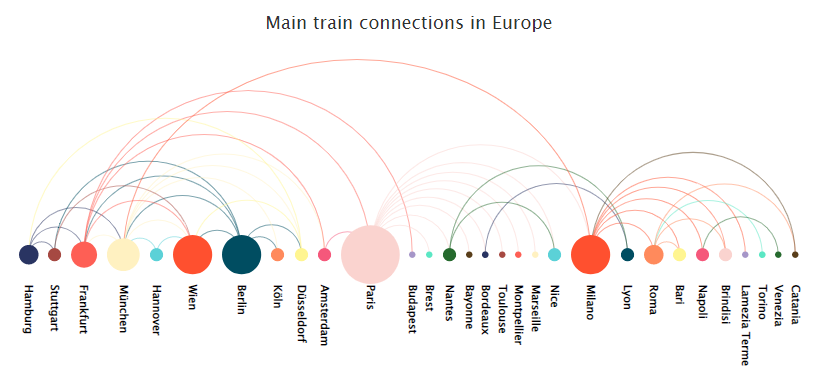
- Return type:
ArcDiagramOptionsorNone
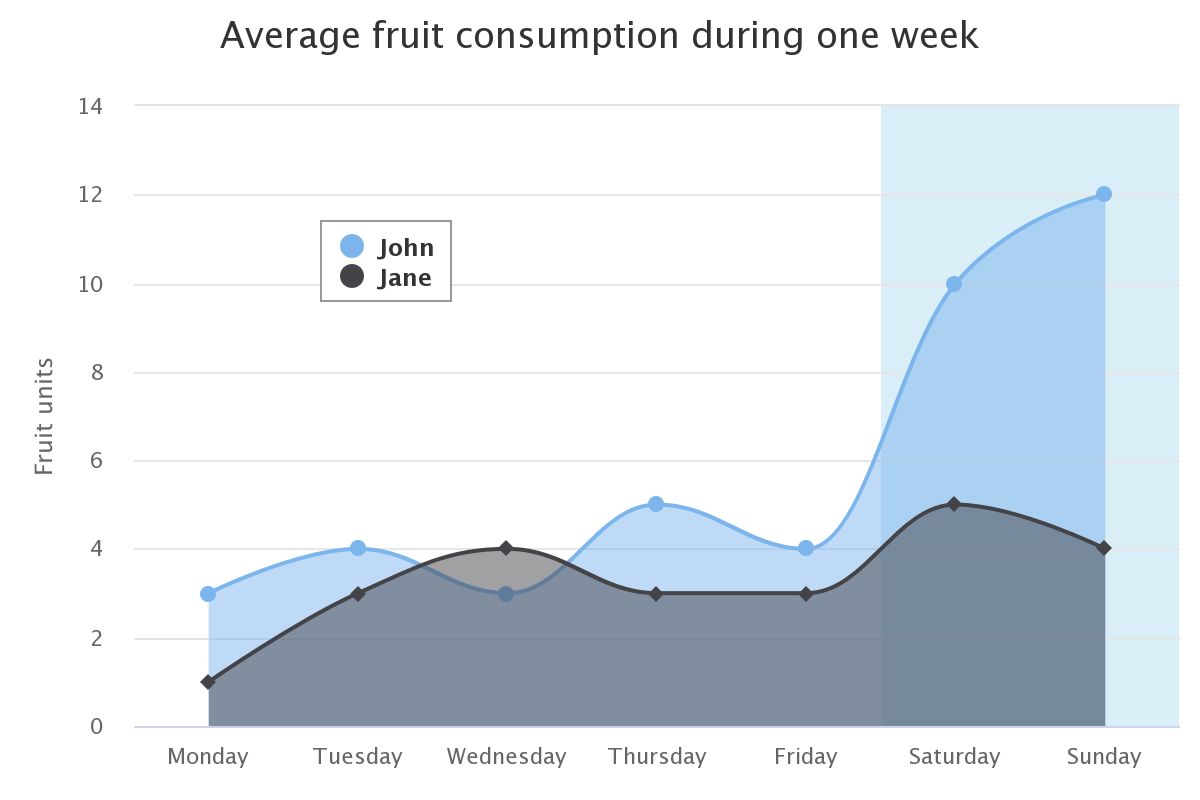
- property area: AreaOptions | None
General options to apply to all Area series types.
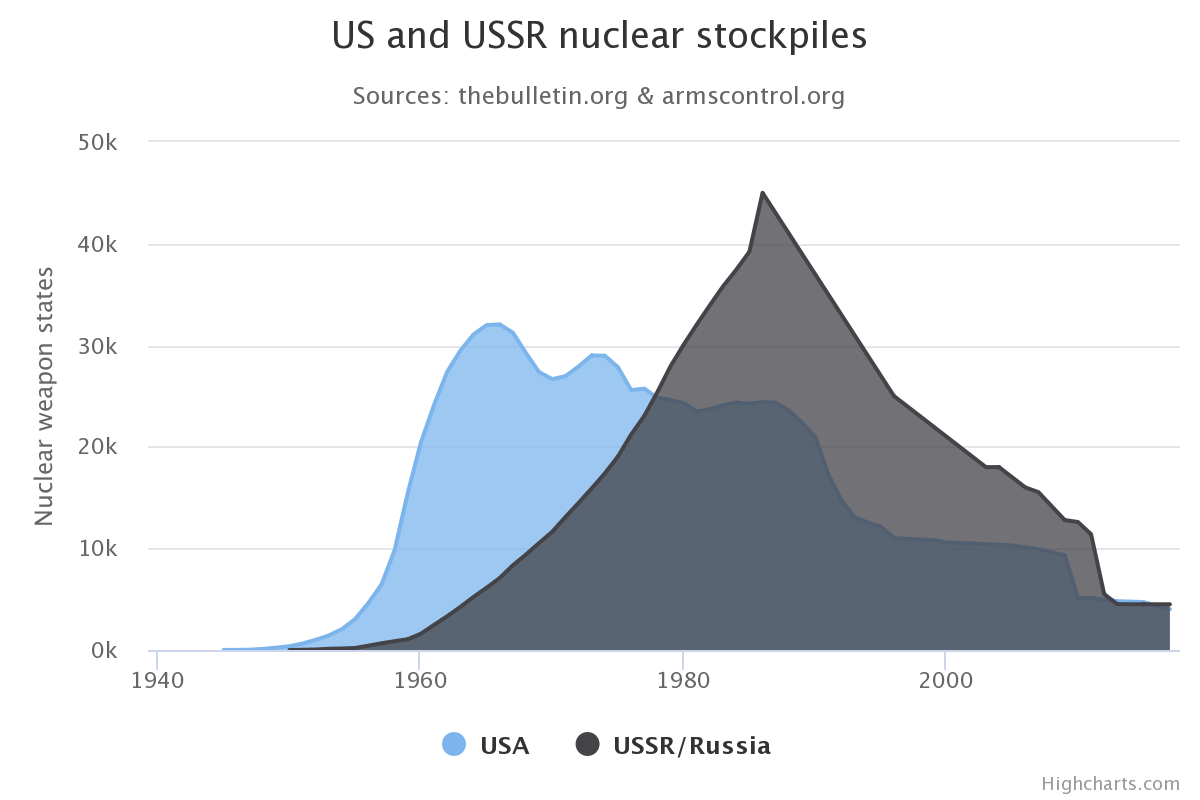
- Return type:
AreaOptionsorNone
- property arearange: AreaRangeOptions | None
General options to apply to all AreaRange series types. The area range series is a carteseian series with higher and lower values for each point along an X axis, where the area between the values is shaded.
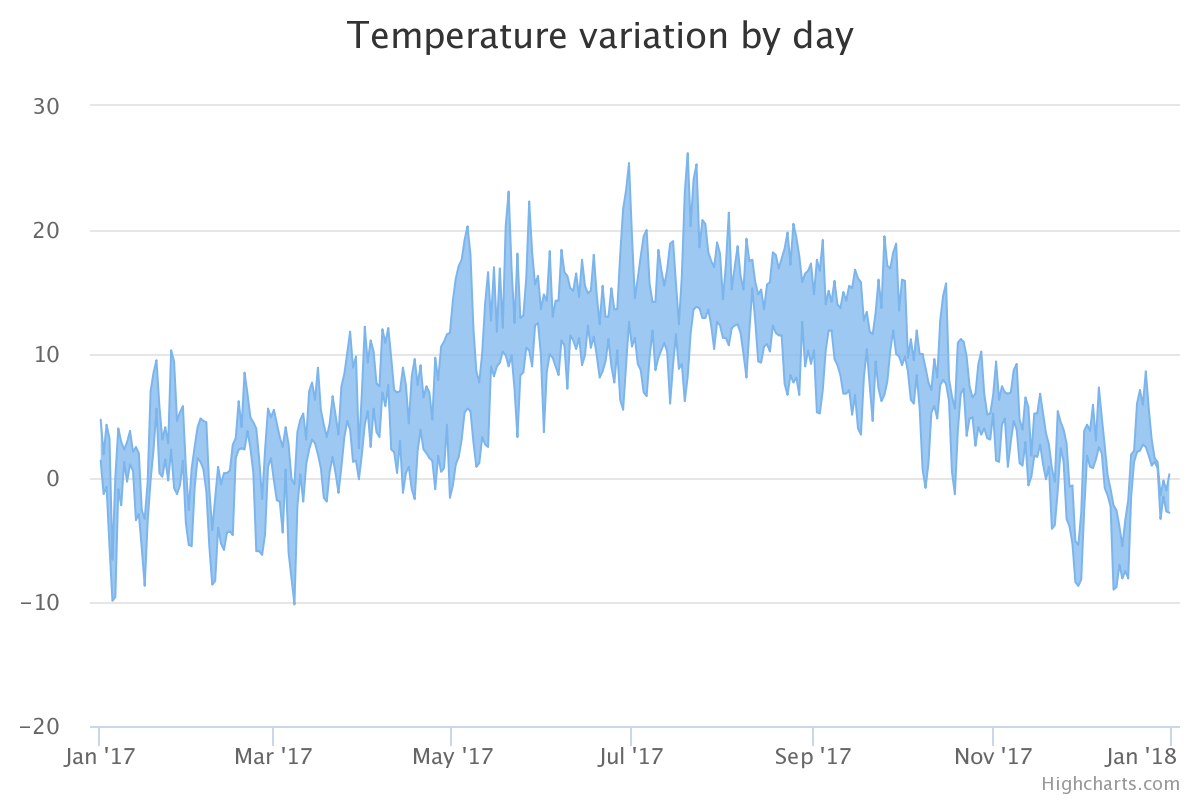
- Return type:
AreaRangeOptionsorNone
- property areaspline: AreaSplineOptions | None
General options to apply to all AreaSpline series types. The area spline series is an area series where the graph between the points is smoothed into a spline.
- Return type:
AreaSplineOptionsorNone
- property areasplinerange: AreaSplineRangeOptions | None
General options to apply to all AreaSplineRange series types. The area spline range series is a carteseian series type with higher and lower Y values along an X axis. The area inside the range is colored, and the graph outlining the area is a smoothed spline.
- Return type:
AreaSplineRangeOptionsorNone
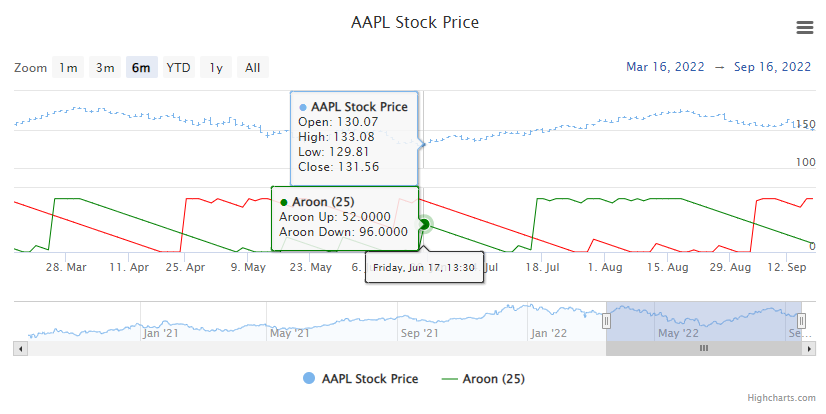
- property aroon: AroonOptions | None
General options for the Aroon indicator, which is a technical indicator used to identify a change in the trend of the value of an asset.
- Return type:
AroonOptionsorNone
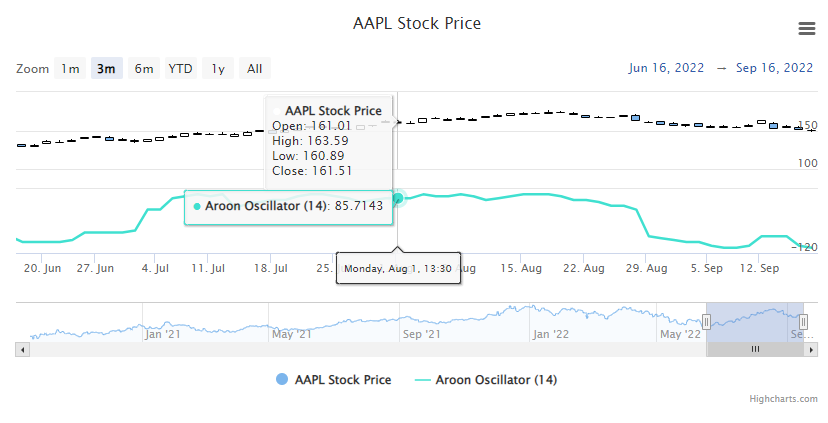
- property aroonoscillator: AroonOscillatorOptions | None
General options to configure an Aroon Oscillator series, which is an oscillator that is used to gauge the strength of a current trend and the likelihood that it will continue.
- Return type:
AroonOscillatorOptionsorNone
- property atr: ATROptions | None
General options to configure an Average True Range indicator, which is a measure of the degree of volatility in a value over time using a look-back period determined by the configuration of
params <highcharts_stock.options.plot_options.atr.ATROptions.params().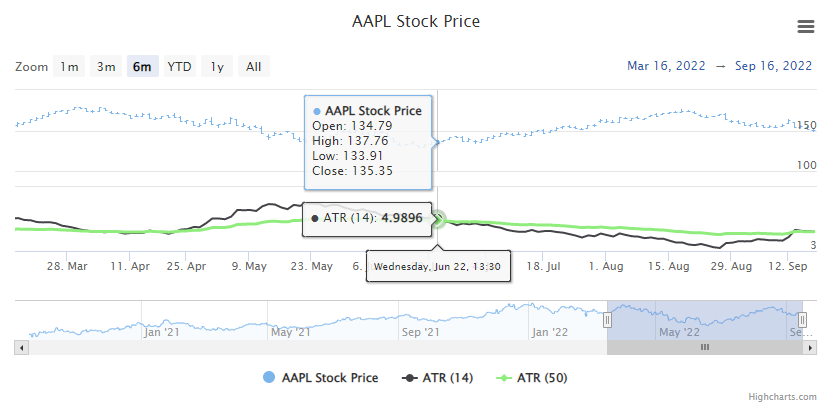
- Return type:
ATROptionsorNone
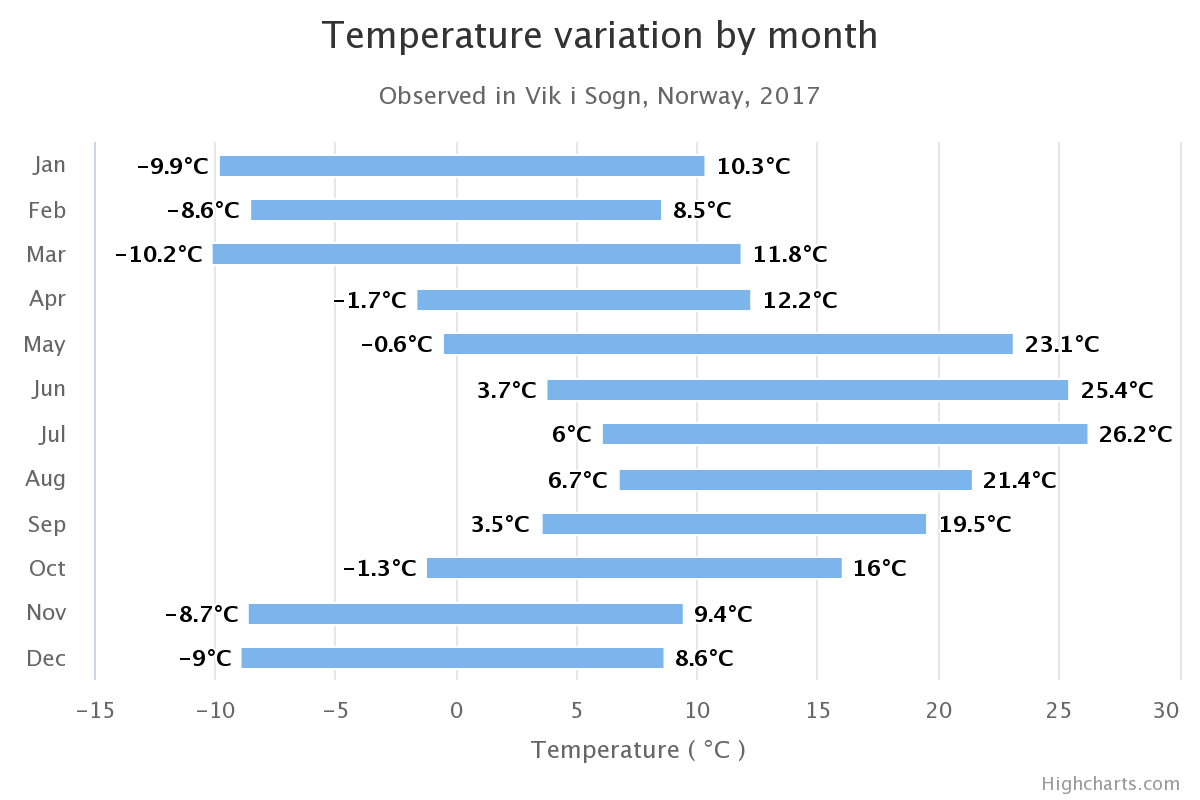
- property bar: BarOptions | None
General options to apply to all Bar series types. A bar series is a special type of column series where the columns are horizontal.
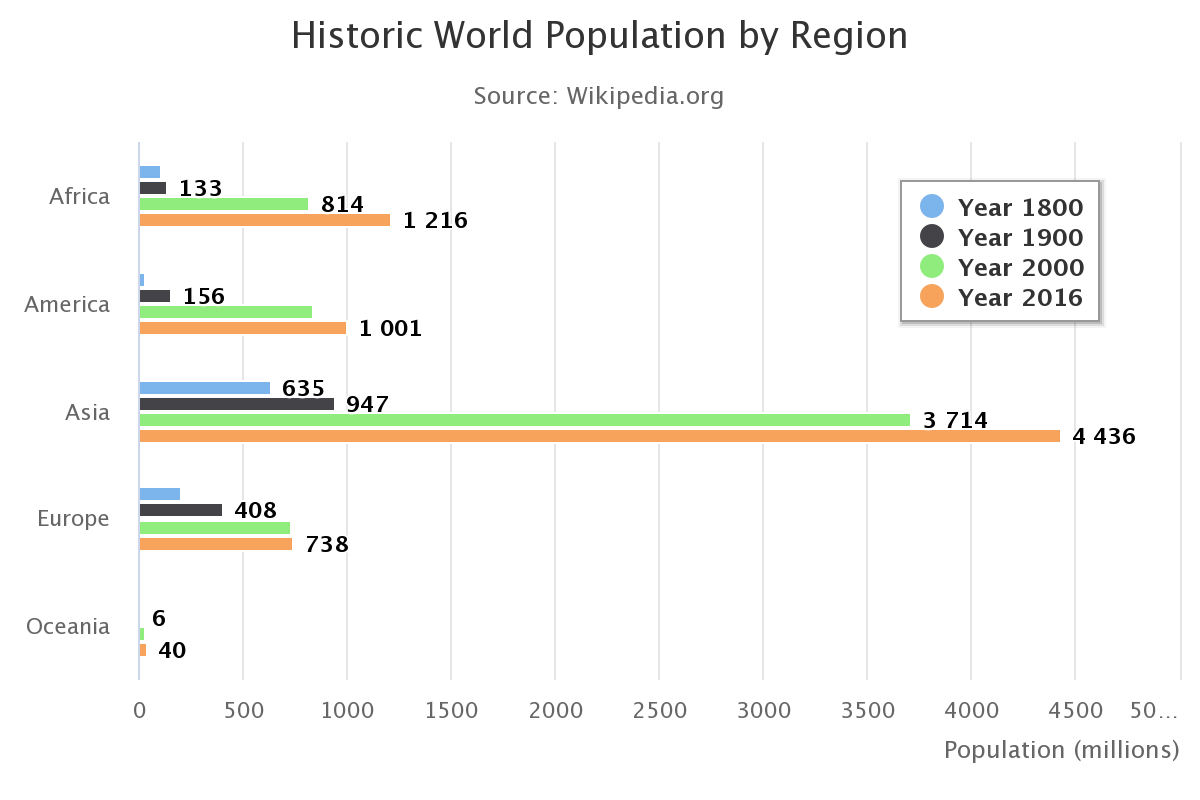
- Return type:
BarOptionsorNone
- property bb: BBOptions | None
General options for Bollinger Bands, a technical indicator.
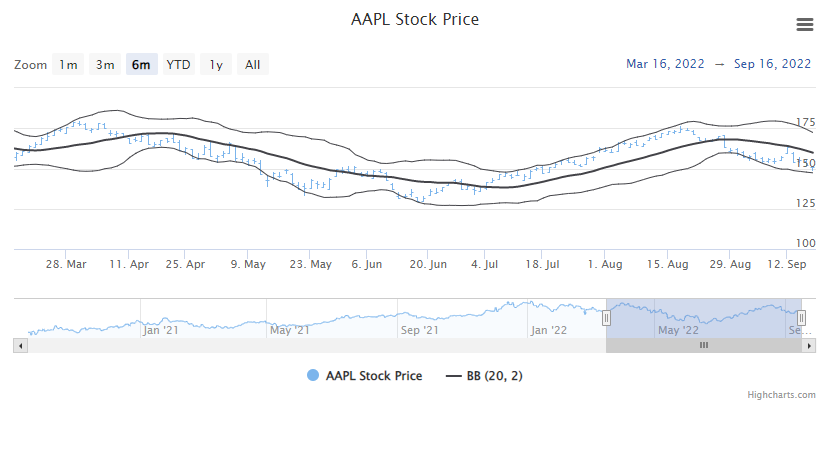
- Return type:
BBOptionsorNone
- property bellcurve: BellCurveOptions | None
General options to apply to all Bell Curve series types.
A bell curve is an areaspline series which represents the probability density function of the normal distribution. It calculates mean and standard deviation of the base series data and plots the curve according to the calculated parameters.
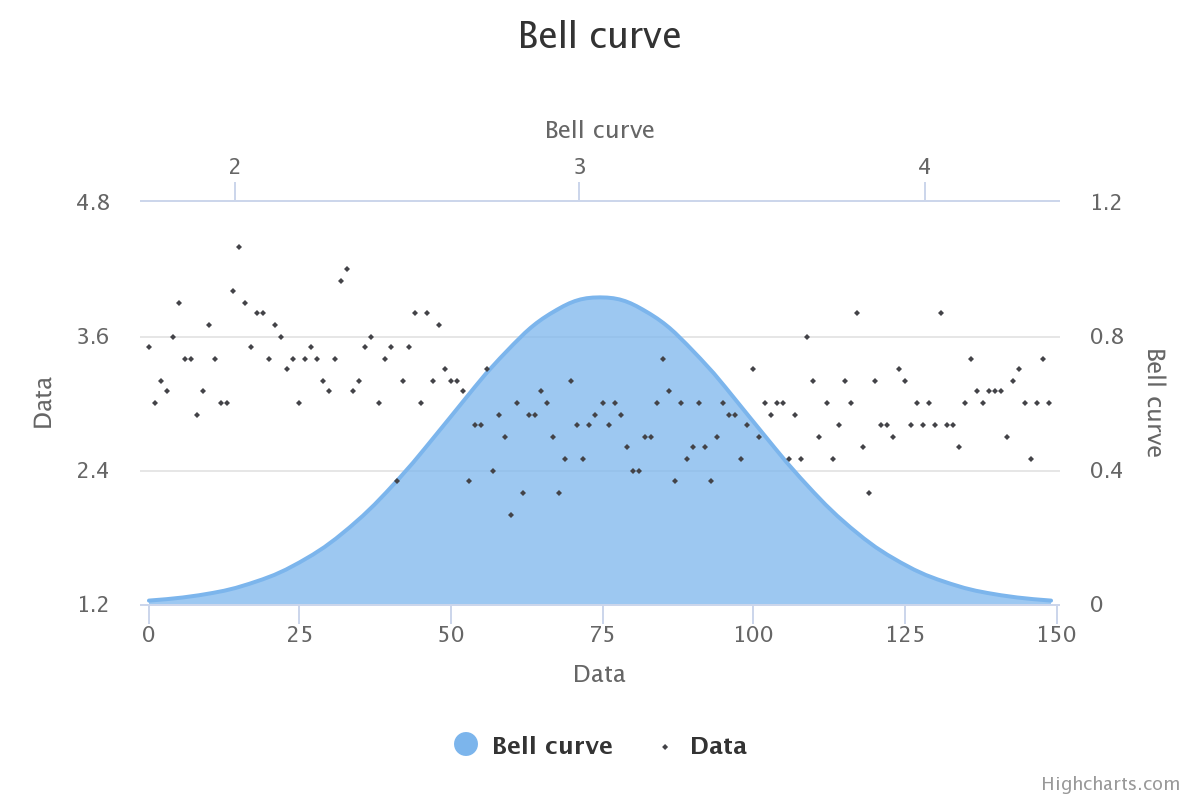
- Return type:
BellCurveOptionsorNone
- property boxplot: BoxPlotOptions | None
General options to apply to all Box Plot series types.
A box plot is a convenient way of depicting groups of data through their five-number summaries:
the smallest observation (sample minimum),
lower quartile (Q1),
median (Q2),
upper quartile (Q3), and
largest observation (sample maximum).
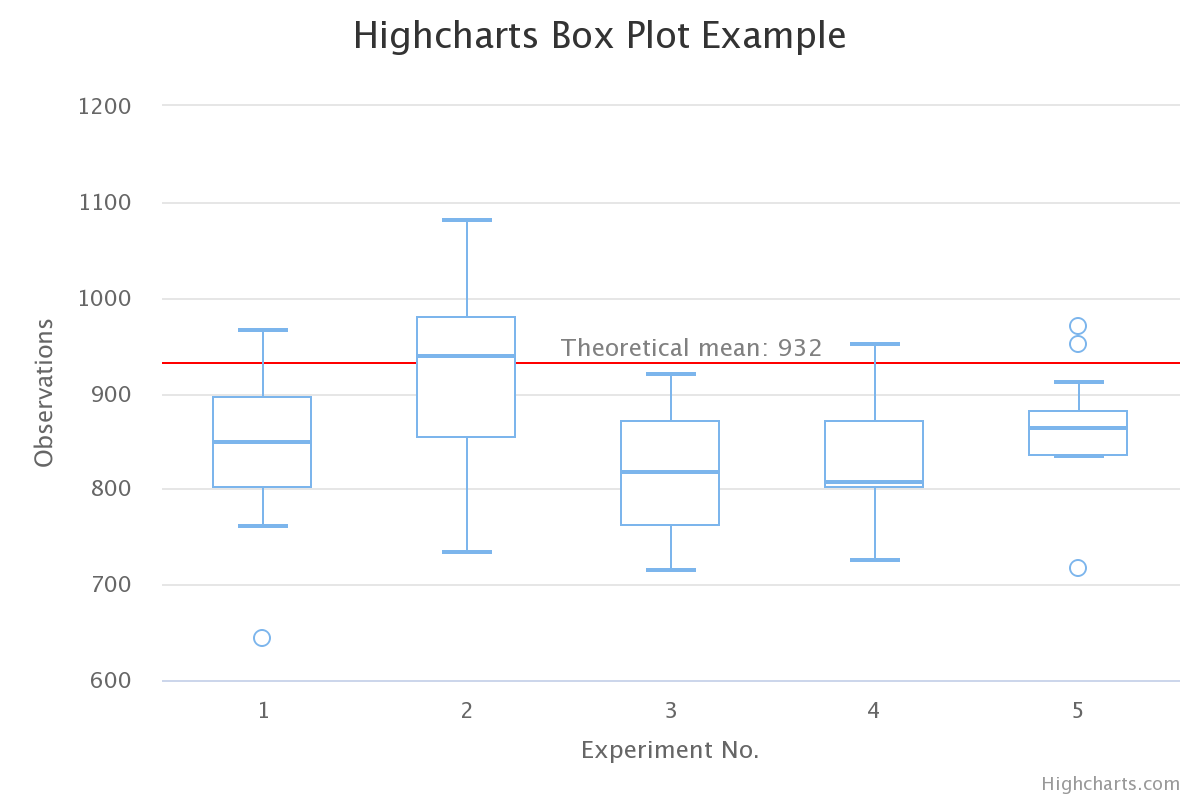
- Return type:
BoxPlotOptionsorNone
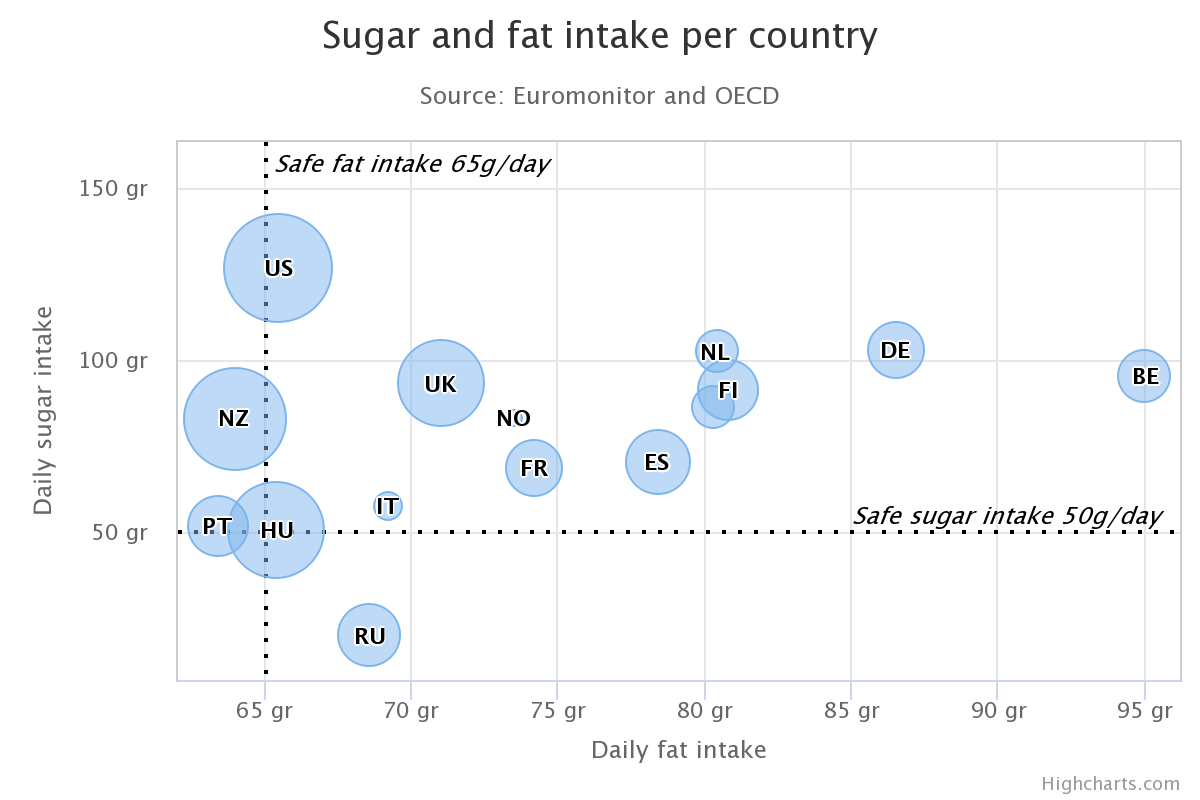
- property bubble: BubbleOptions | None
General options to apply to all Bubble series types.
A bubble series is a three dimensional series type where each point renders an X, Y, and Z value. Each points is drawn as a bubble where the position along the X and Y axes mark the X and Y values, and the size of the bubble relates to the Z value.
- Return type:
BubbleOptionsorNone
- property bullet: BulletOptions | None
General options to apply to all Bullet series types.
A bullet graph is a variation of a bar graph. The bullet graph features a single measure, compares it to a target, and displays it in the context of qualitative ranges of performance that could be set using
YAxis.plot_bands().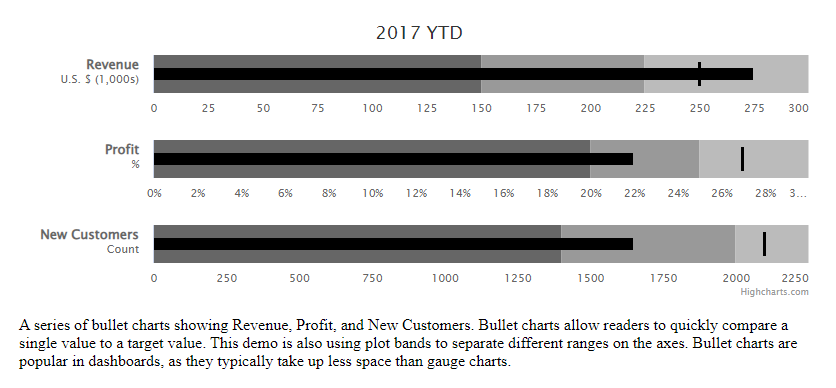
- Return type:
BulletOptionsorNone
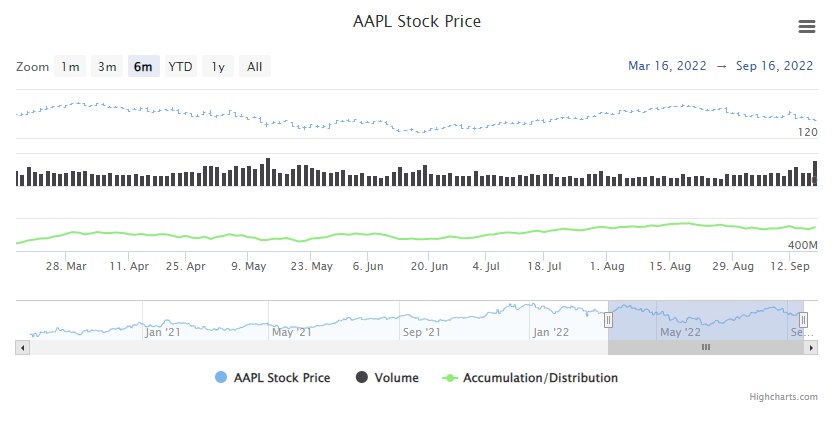
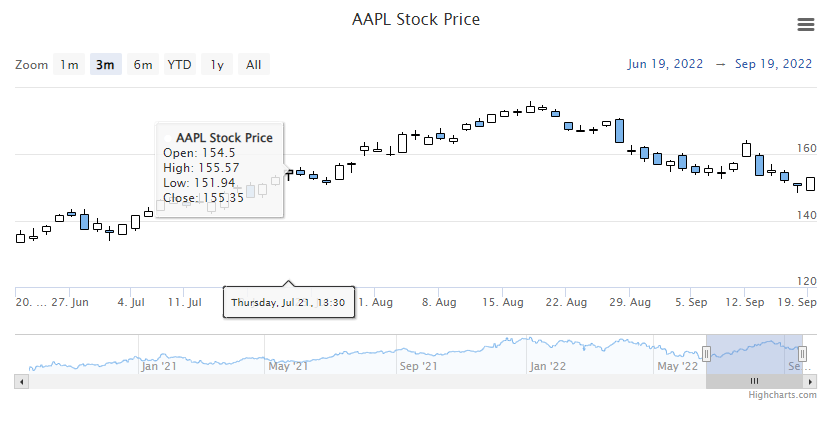
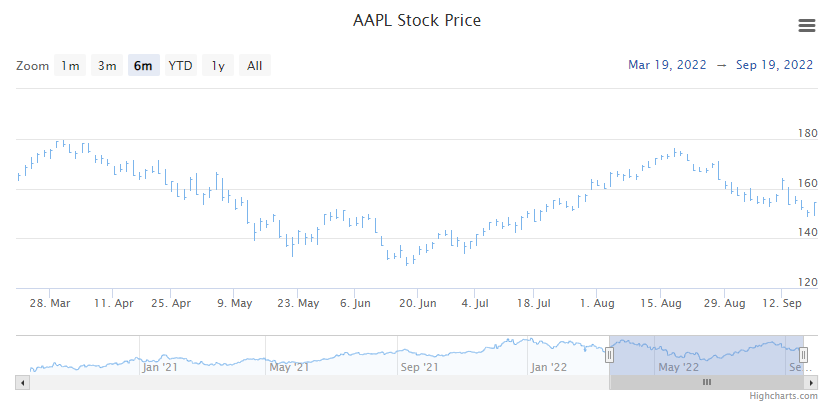
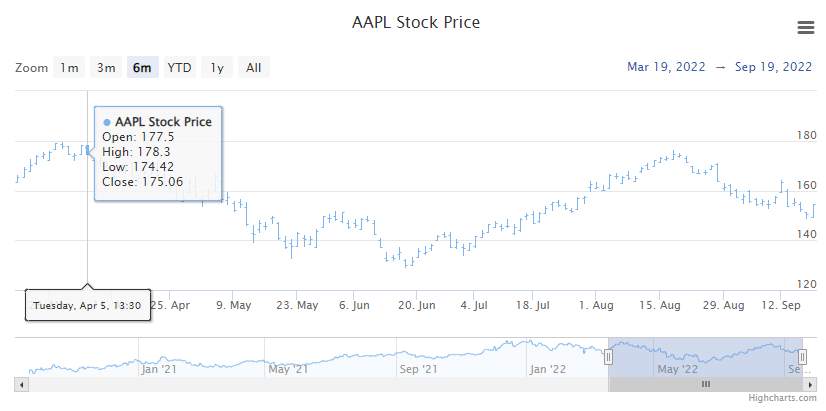
- property candlestick: CandlestickOptions | None
General options to apply to all Candlestick series types. A candlestick chart is a style of financial chart used to describe price movements over time.
- Return type:
CandlestickOptionsorNone
- property cci: CCIOptions | None
General options to configure a Commodity Channel Index indicator, which is an oscillator that measures the difference between the current price and the historical average price using a look-back period determined by the configuration of
params <highcharts_stock.options.plot_options.atr.CCIOptions.params().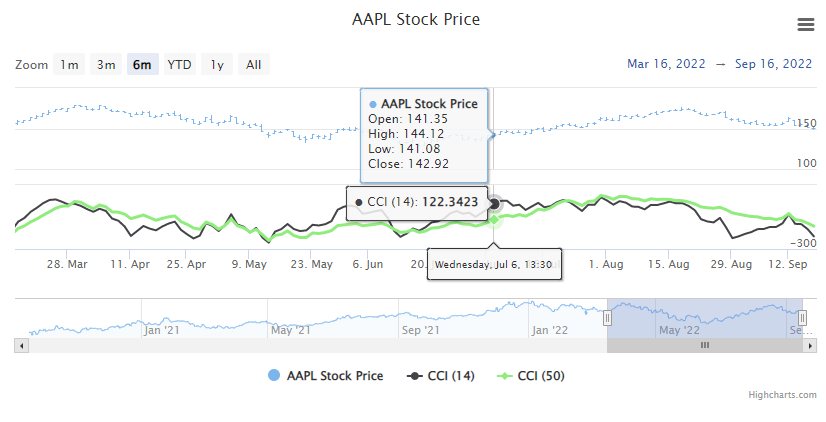
- Return type:
CCIOptionsorNone
- property chaikin: ChaikinOptions | None
General options to configure a Chaikin oscillator, which measures the accummulation-distribution line of moving average convergence-divergence by subtracting a 10-day exponential moving average from a 3-day moving average of the accumulation-distribution line.
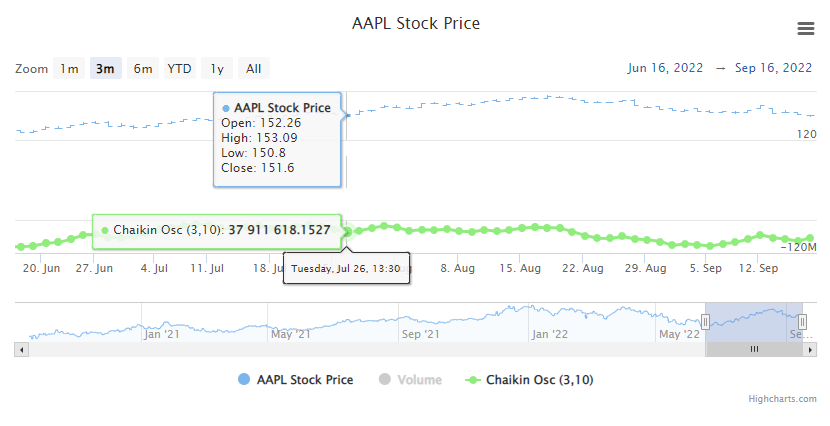
- Return type:
ChaikinOptionsorNone
- property cmf: CMFOptions | None
General options to configure a Chaikin Money Flow indicator, which uses price and volume data to identify over-bought or over-sold signals in an asset.
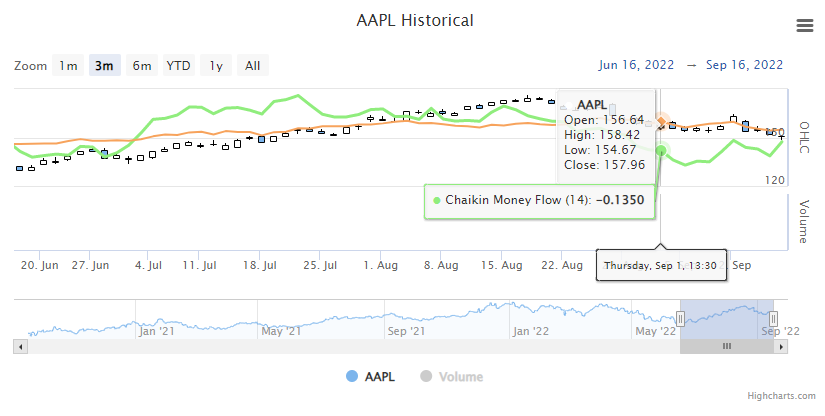
- Return type:
CMFOptionsorNone
- property cmo: CMOOptions | None
General options to configure a Chande Momentum Oscillator, which uses momentum to identify relative strength or weakness in a market.
Caution
The chosen time frame - configured by
params.period <highcharts_stock.options.plot_options.atr.CCIOptions.params()and defaulting to a value of20- has a significant impact on the signals generated by the indicator.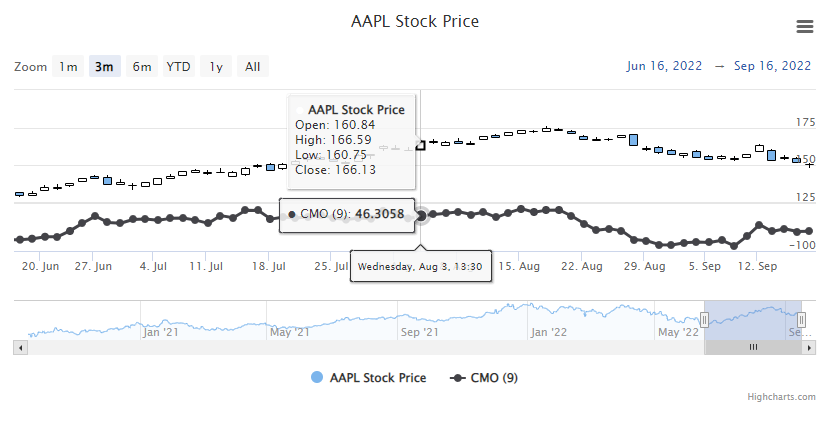
- Return type:
CMOOptionsorNone
- property column: ColumnOptions | None
General options to apply to all Column series types.
Column series display one column per value along an X axis.
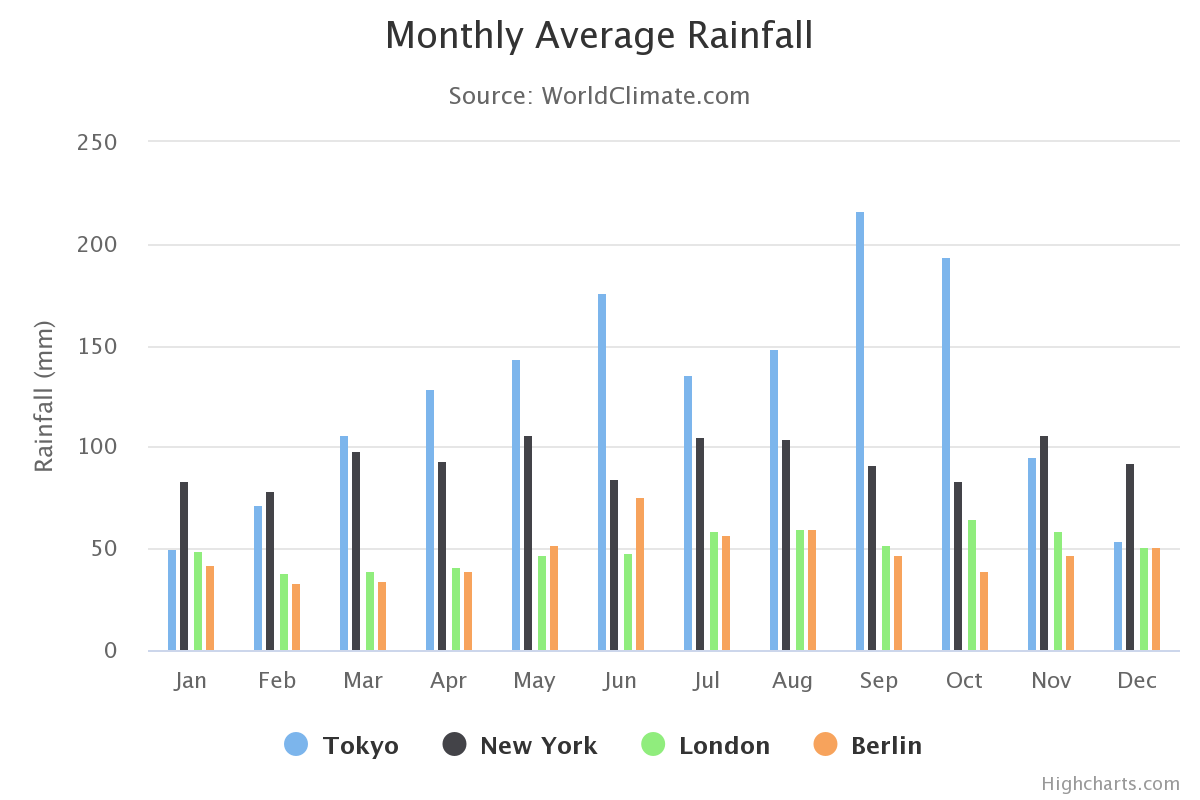
- Return type:
ColumnOptionsorNone
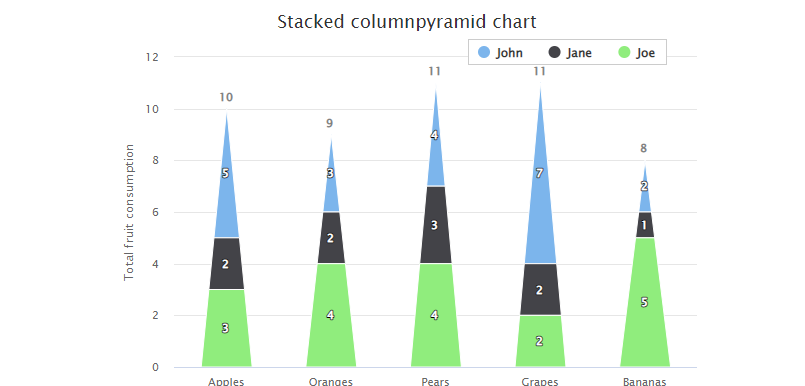
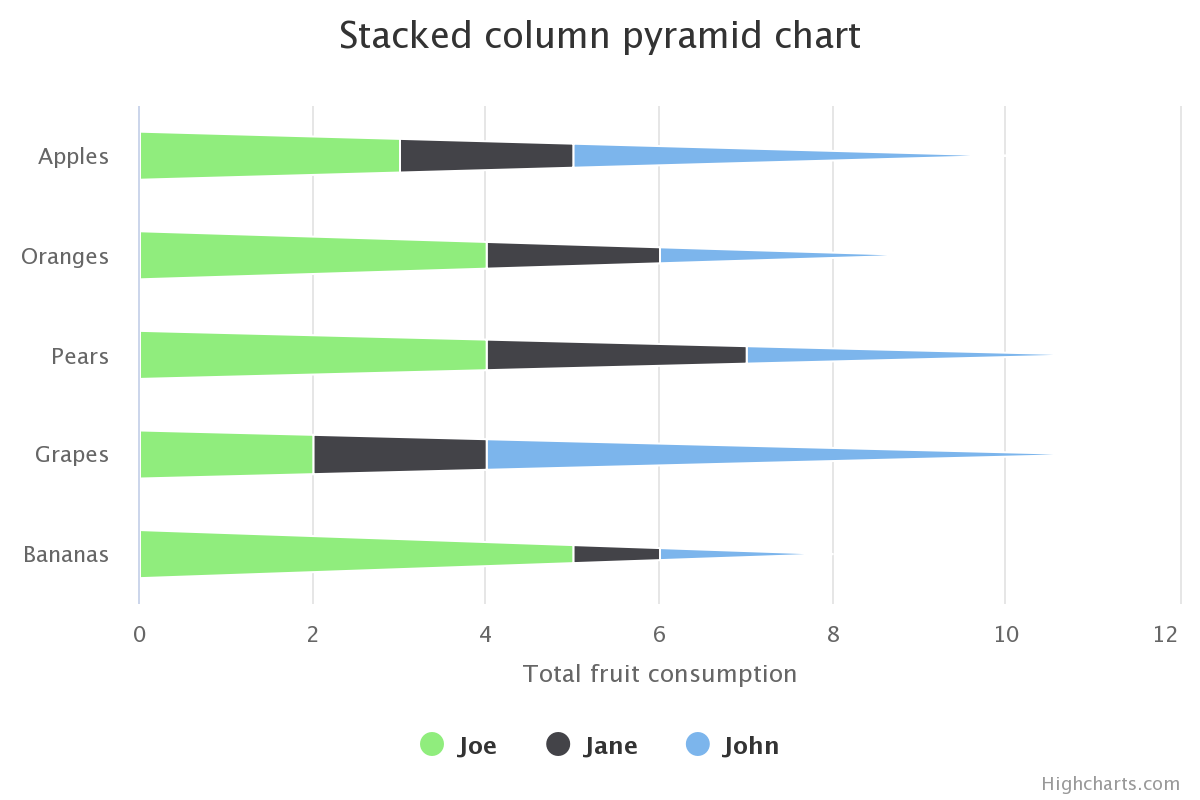
- property columnpyramid: ColumnPyramidOptions | None
General options to apply to all Column Pyramid series types.
Column Pyramid series display one pyramid per value along an X axis.
Hint
To display horizontal pyramids, set
Chart.inverted()toTrue.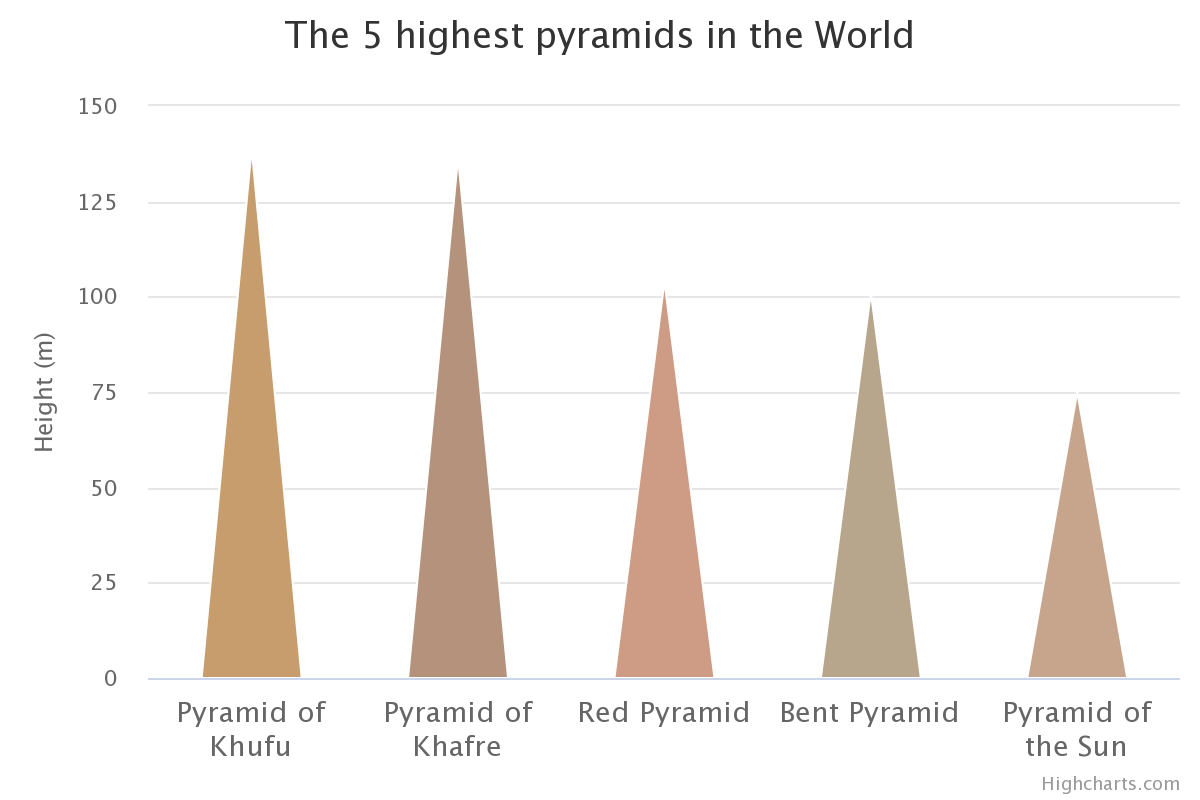
- Return type:
ColumnPyramidOptionsorNone
- property columnrange: ColumnRangeOptions | None
General options to apply to all Column Range series types.
The column range is a cartesian series type with higher and lower Y values along an X axis.
Hint
To display horizontal bars, set
Chart.inverted()toTrue.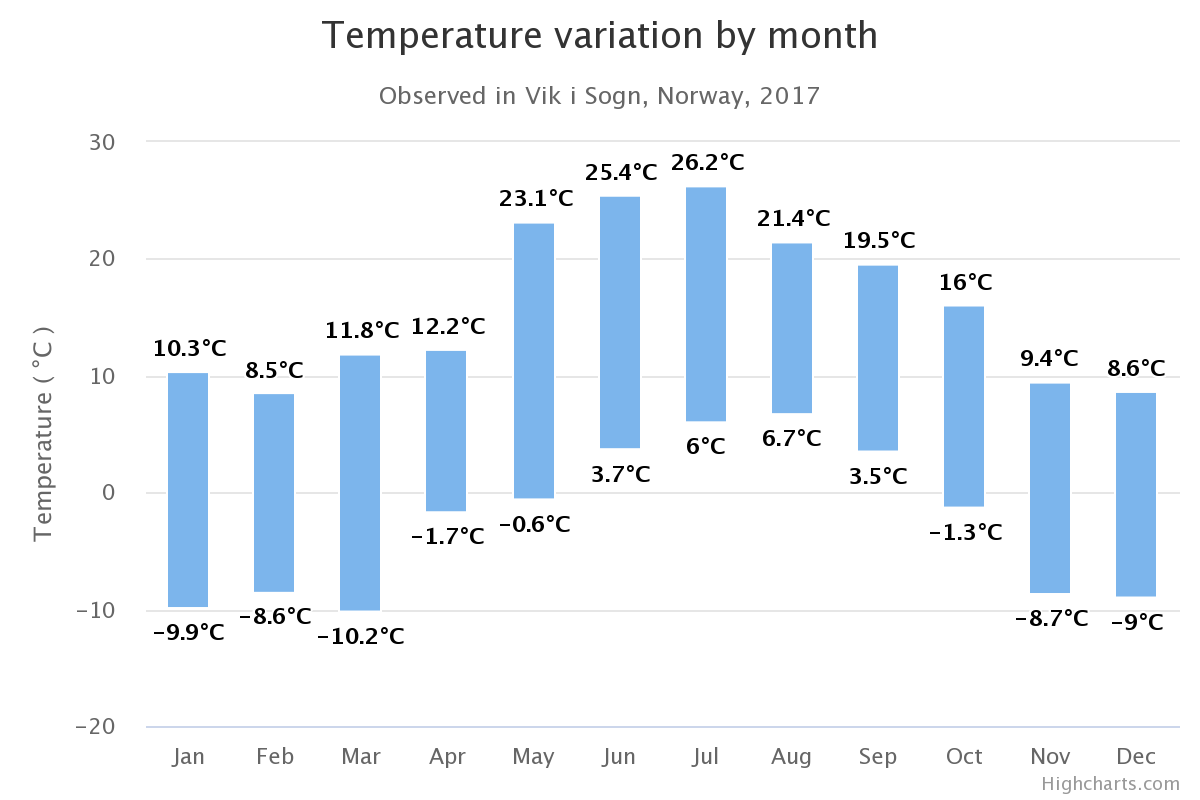
- Return type:
ColumnRangeOptionsorNone
- property cylinder: CylinderOptions | None
General options to apply to all Cylinder series types.
A cylinder graph is a variation of a 3d column graph. The cylinder graph features cylindrical points.
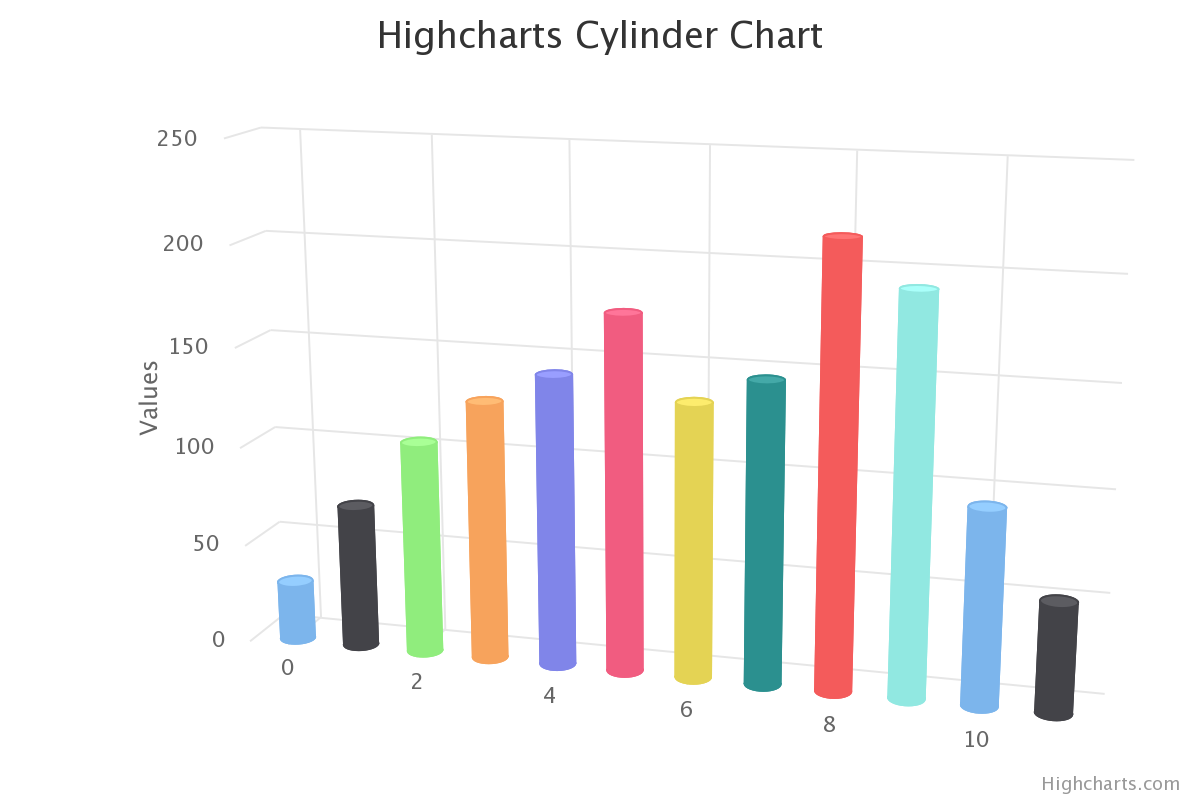
- Return type:
CylinderOptionsorNone
- property dema: DEMAOptions | None
General options to configure a Double Exponential Moving Average indicator, which is often used to reduce the “noise” produced on a simple moving average.
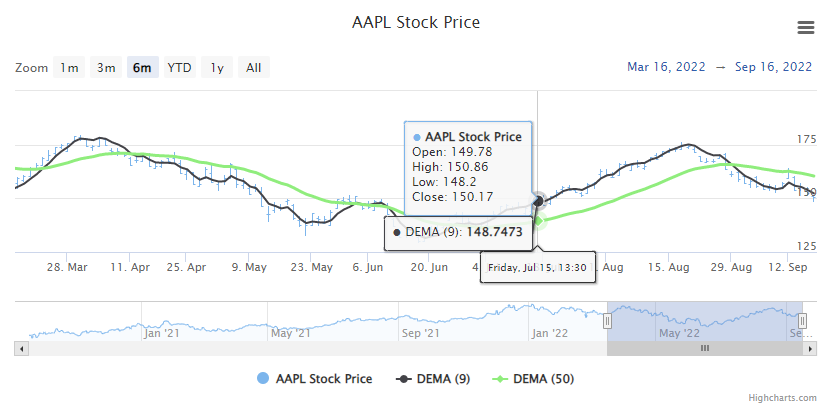
- Return type:
DEMAOptionsorNone
- property dependencywheel: DependencyWheelOptions | None
General options to apply to all Dependency Wheel series types.
A dependency wheel chart is a type of flow diagram, where all nodes are laid out in a circle, and the flow between the are drawn as link bands.
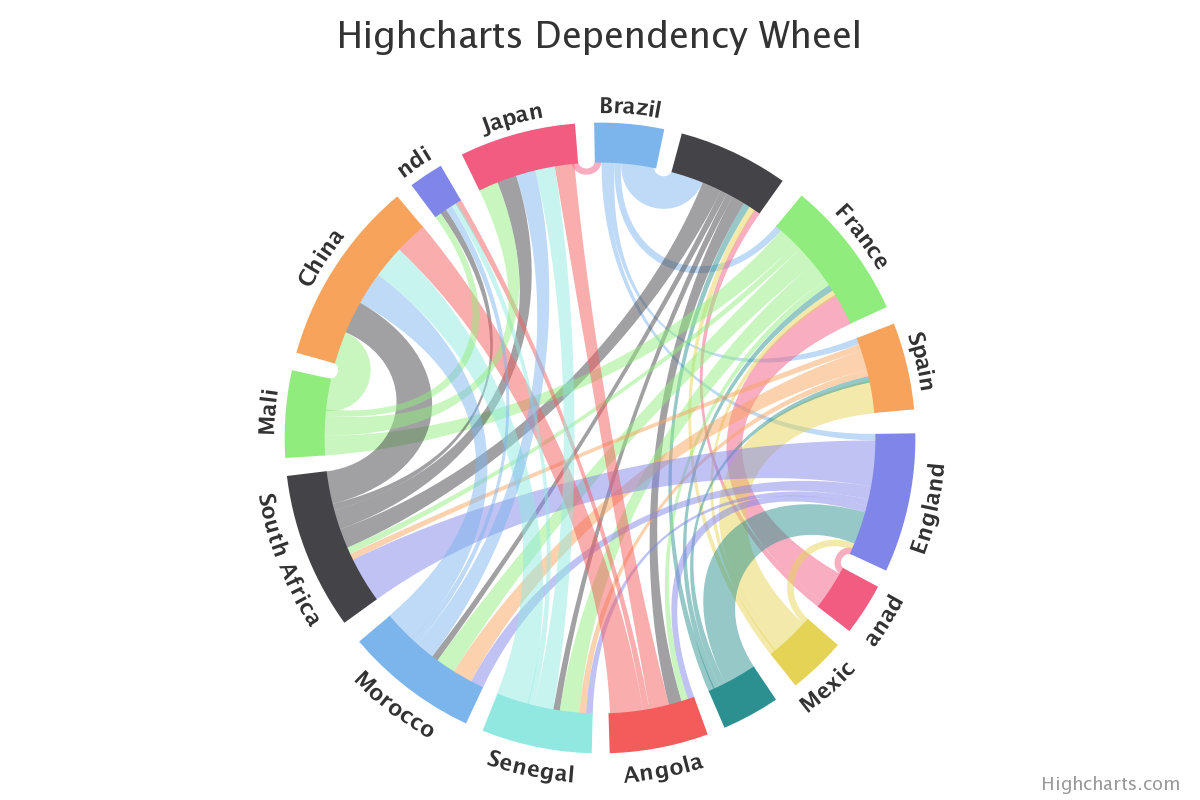
- Return type:
DependencyWheelOptionsorNone
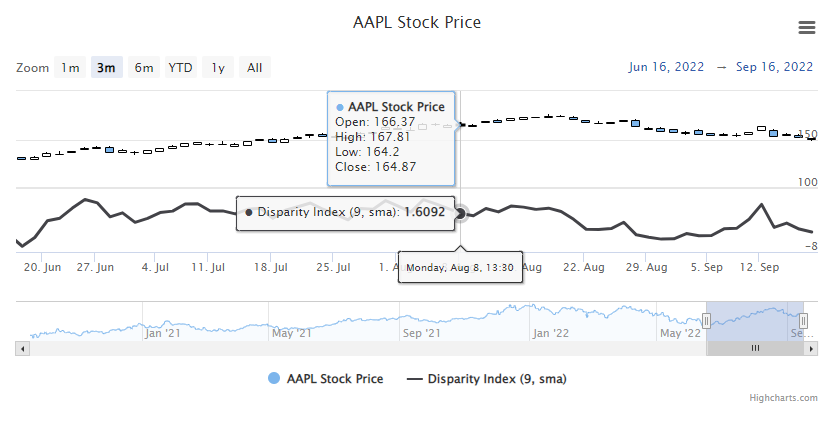
- property disparityindex: DisparityIndexOptions | None
General options to configure a Disparity Index indicator, which measures the relative position of the most-recent value to a selected moving average, expressed as a percentage.
- Return type:
DisparityIndexOptionsorNone
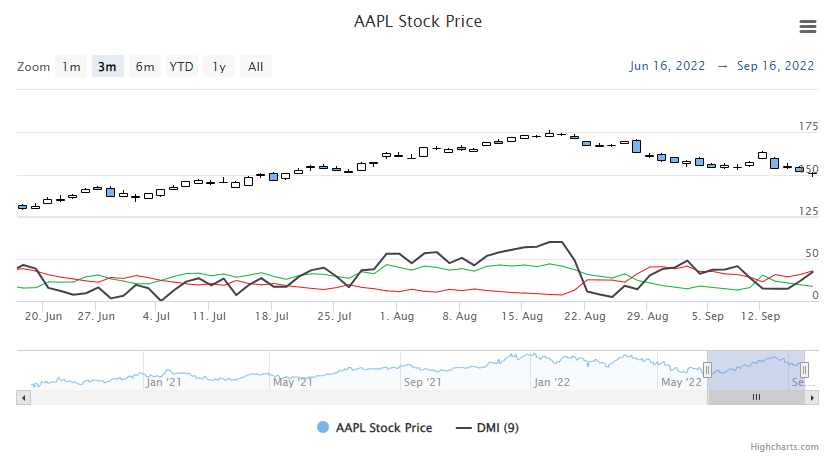
- property dmi: DMIOptions | None
General options to configure a Directional Movement Index (DMI) indicator, which can be used to identify whether an asset is trending by comparing highs and lows over time.
- Return type:
DMIOptionsorNone
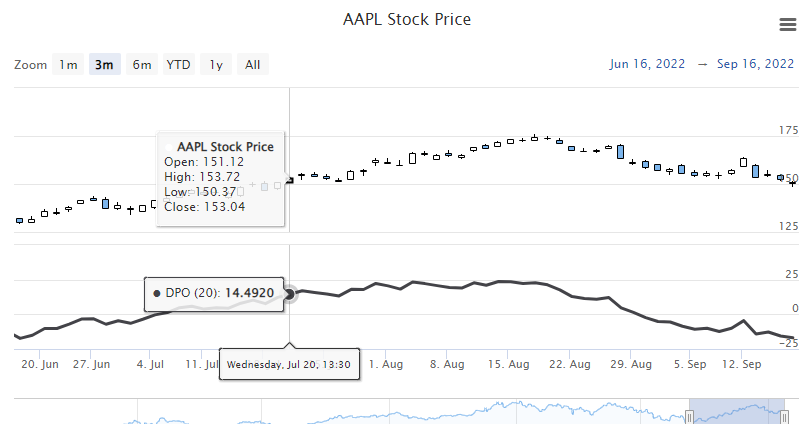
- property dpo: DPOOptions | None
General options to configure a Detrended Price Oscillator, which strips out price trends in an effort to estimate the length of price cycles.
- Return type:
DPOOptionsorNone
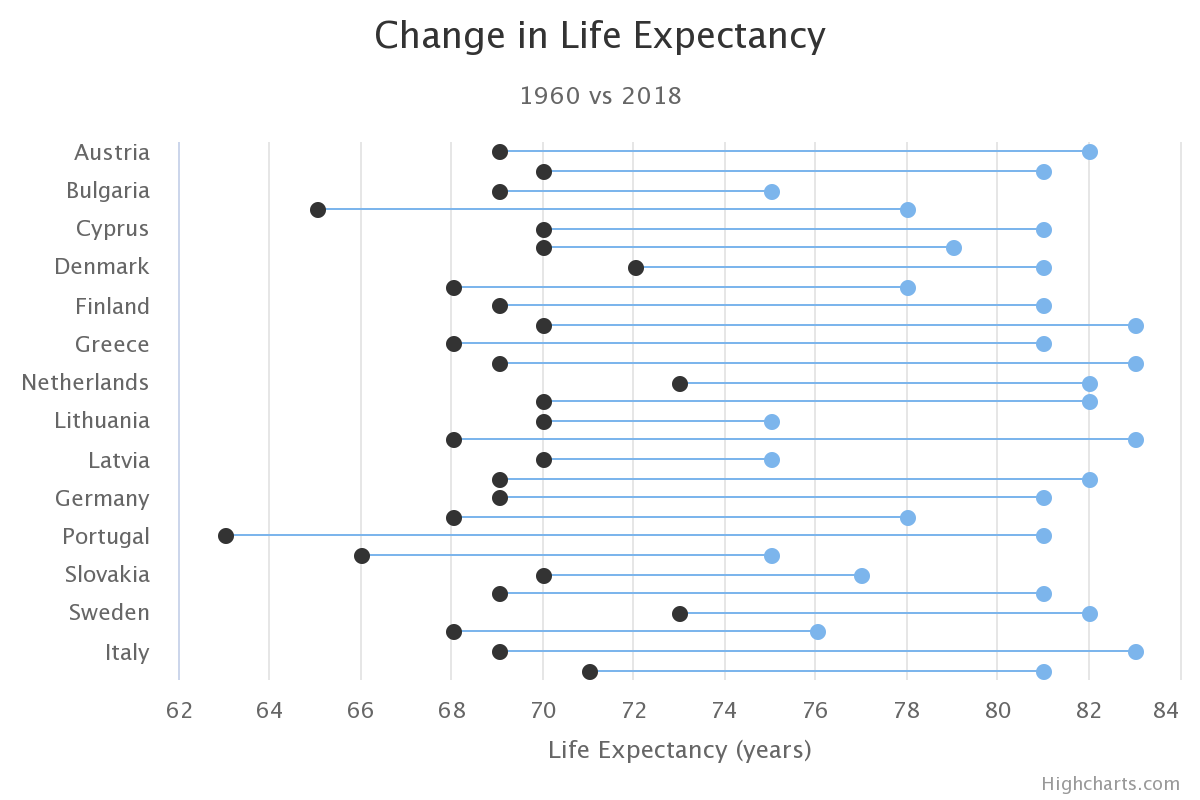
- property dumbbell: DumbbellOptions | None
General options to apply to all Dumbbell series types.
The dumbbell series is a cartesian series with higher and lower values for each point along an X axis, connected with a line between the values.
Warning
Requires
highcharts-more.jsandmodules/dumbbell.jsbe loaded client-side.- Return type:
DumbbellOptionsorNone
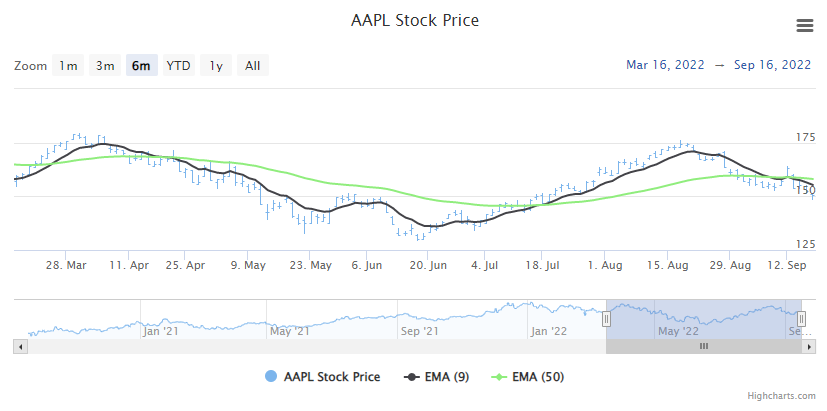
- property ema: EMAOptions | None
General options to configure an Exponential Moving Average indicator, which is used to give greater weight to recent values.
- Return type:
EMAOptionsorNone
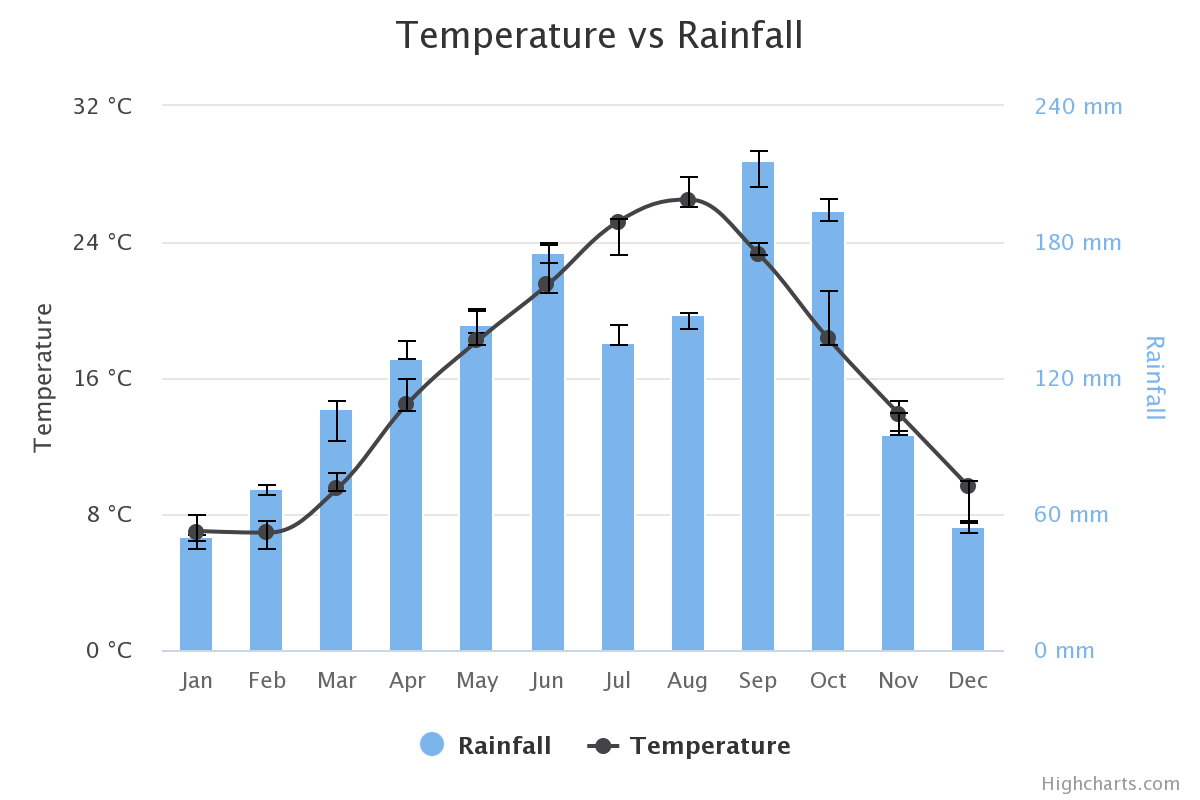
- property errorbar: ErrorBarOptions | None
General options to apply to all Error Bar series types.
Error bars are a graphical representation of the variability of data and are used on graphs to indicate the error, or uncertainty in a reported measurement.
- Return type:
ErrorBarOptionsorNone
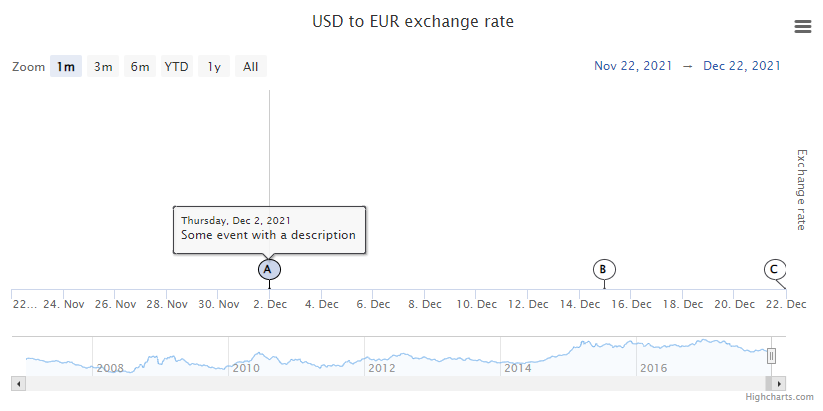
- property flags: FlagsOptions | None
General options to configure flags, which are used to mark events in Highcharts Stock for Python. They can be added on the timeline, or attached to a specific series.
- Return type:
FlagsOptionsorNone
- property funnel: FunnelOptions | None
General options to apply to all Funnel series types.
Funnel charts are a type of chart often used to visualize stages in a sales project, where the top are the initial stages with the most clients.
Warning
Funnel charts require that the
modules/funnel.jsfile is loaded client-side.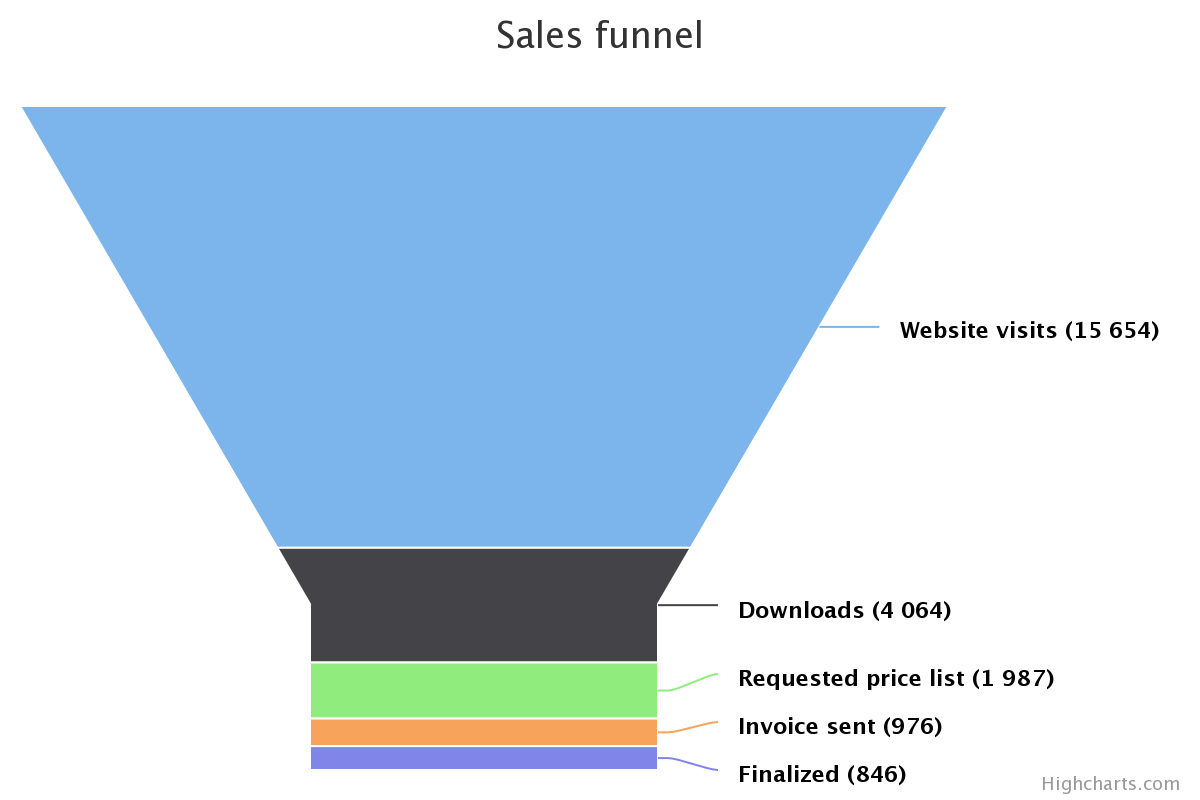
- Return type:
FunnelOptionsorNone
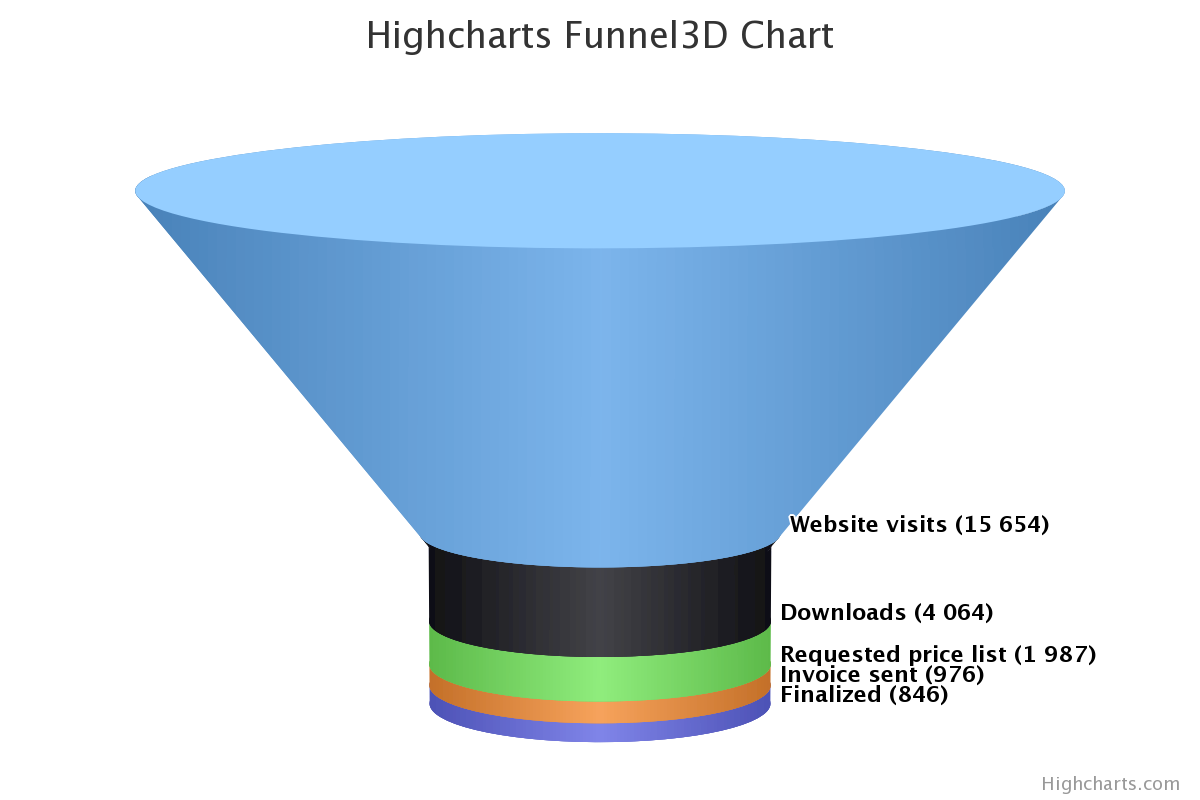
- property funnel_3d: Funnel3DOptions | None
General options to apply to all Funnel 3D series types.
A Funnel 3D chart is a three-dimensional version of funnel series type. Funnel charts are a type of chart often used to visualize stages in a sales project, where the top are the initial stages with the most clients.
Warning
Funnel 3D charts require that the following files are all loaded client-side:
highcharts-3d.js,cylinder.jsandfunnel3d.js
- Return type:
FunnelOptionsorNone
- property gantt: GanttOptions | None
Configuration for Gantt options.
- Return type:
GanttOptionsorNone
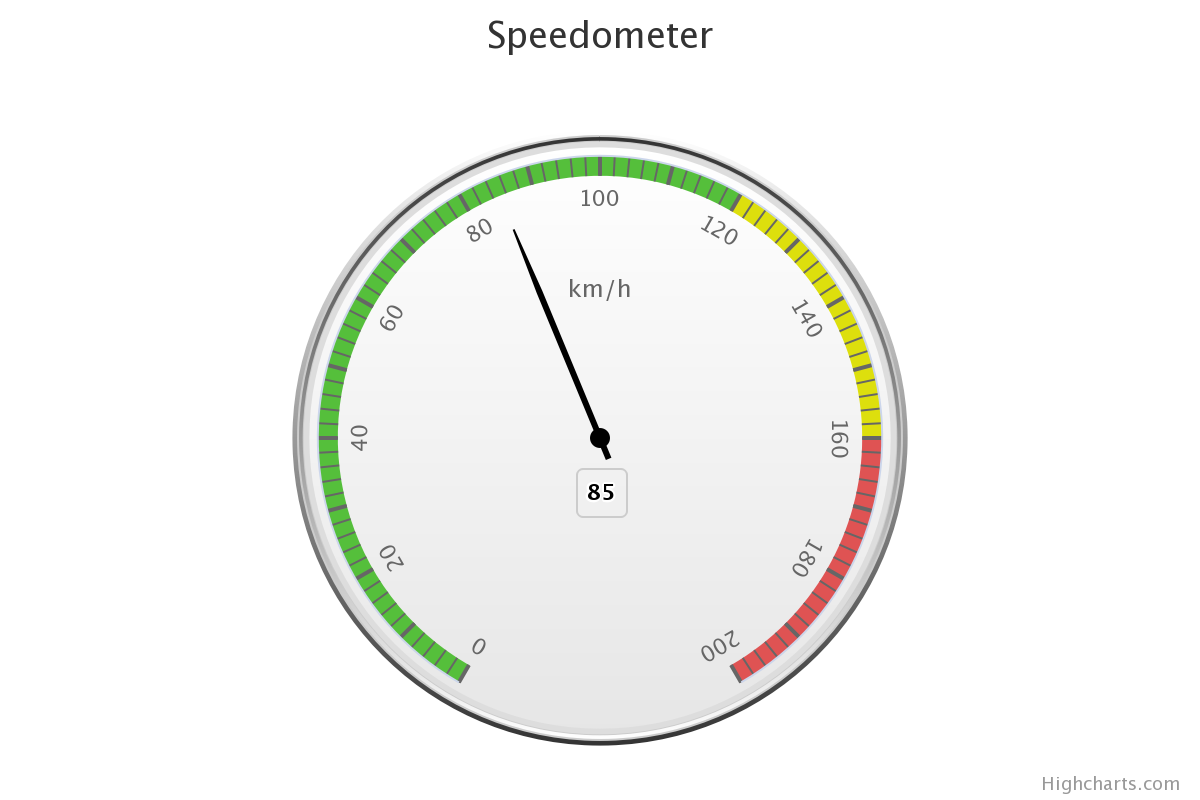
- property gauge: GaugeOptions | None
General options to apply to all Gauge series types.
Gauges are circular plots displaying one or more values with a dial pointing to values along the perimeter.
- Return type:
GaugeOptionsorNone
- property heatmap: HeatmapOptions | None
General options to apply to all Heatmap series types.
A heatmap is a graphical representation of data where the individual values contained in a matrix are represented as colors.
Warning
Heatmaps require that
modules/heatmapis loaded client-side.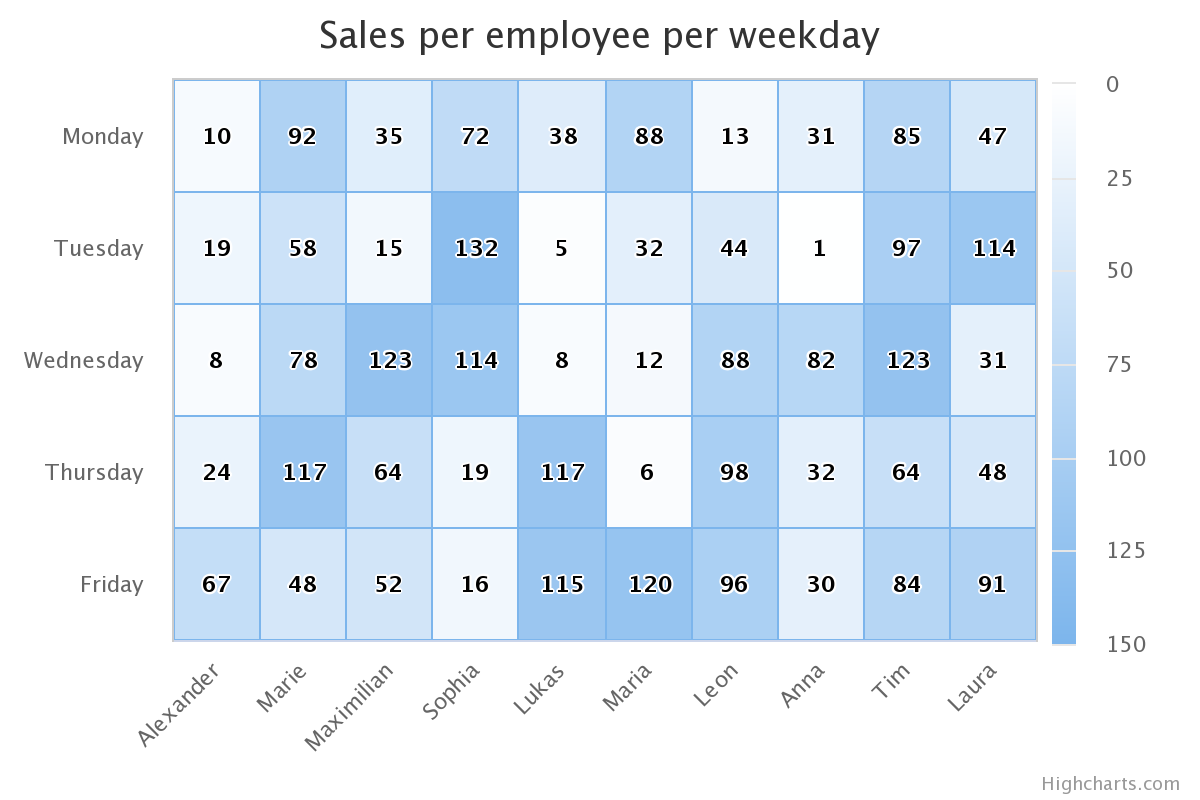
- Return type:
HeatmapOptionsorNone
- property heikinashi: HeikinAshiOptions | None
General options to apply to Heikin Ashi series types, which are visualized similarly to
CandlestickSeriesbut which feature a smoother line by tracking ranges of movement rather than individual movements.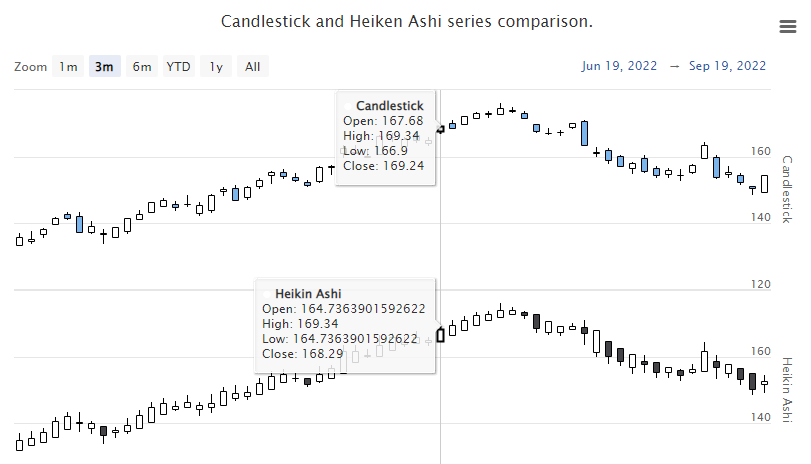
- Return type:
HeikinAshiOptionsorNone
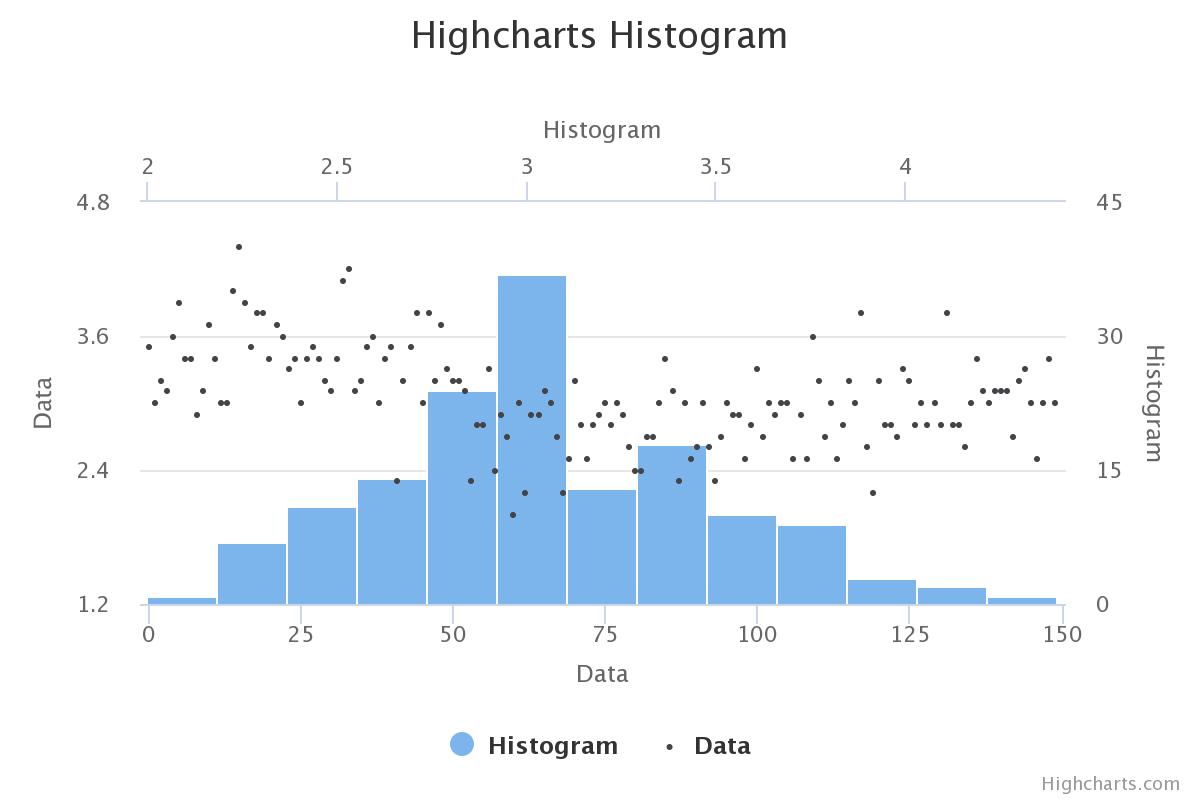
- property histogram: HistogramOptions | None
General options to apply to all Histogram series types.
A histogram is a column series which represents the distribution of the data set in the base series. Histogram splits data into bins and shows their frequencies.
- Return type:
HistogramOptionsorNone
- property hlc: HLCOptions | None
General options to apply to all HLC series types. An HLC chart is a style of financial chart used to describe price movements over time.
- Return type:
HLCOptionsorNone
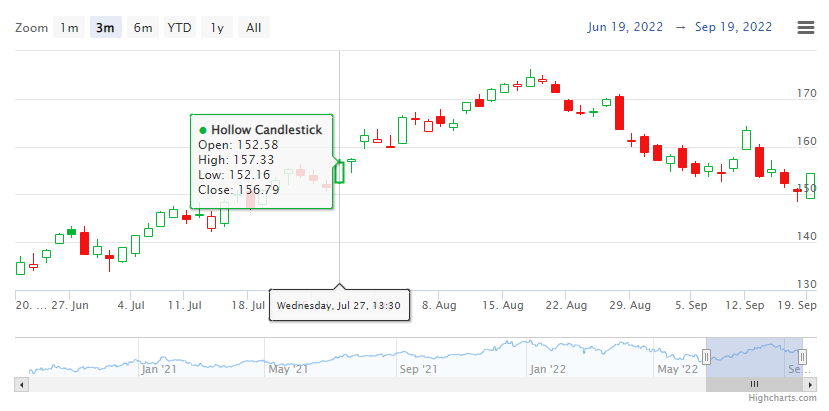
- property hollowcandlestick: HollowCandlestickOptions | None
General options to apply to Hollow Candlestick series types. A candlestick chart is a style of financial chart used to describe price movements over time.
- Return type:
HollowCandlestickOptionsorNone
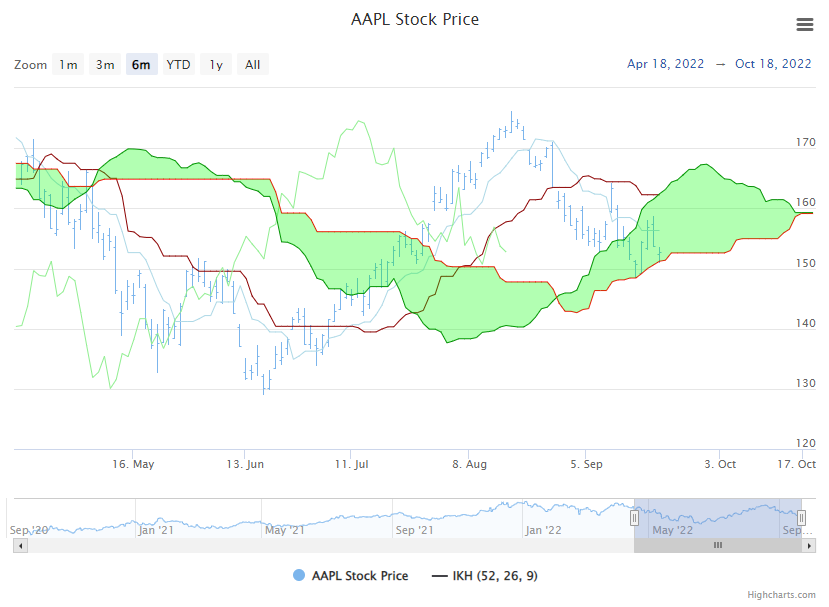
- property ikh: IKHOptions | None
General options to configure a Ichimoku Kinko Hyo (IKH, or “ichimoku”), a momentum indicator.
- Return type:
IKHOptionsorNone
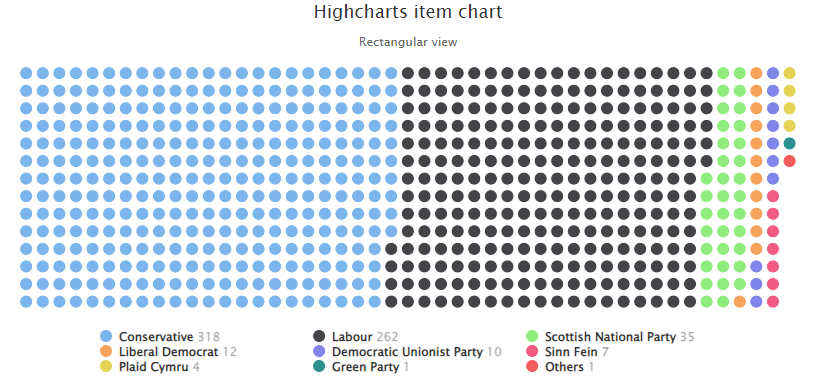
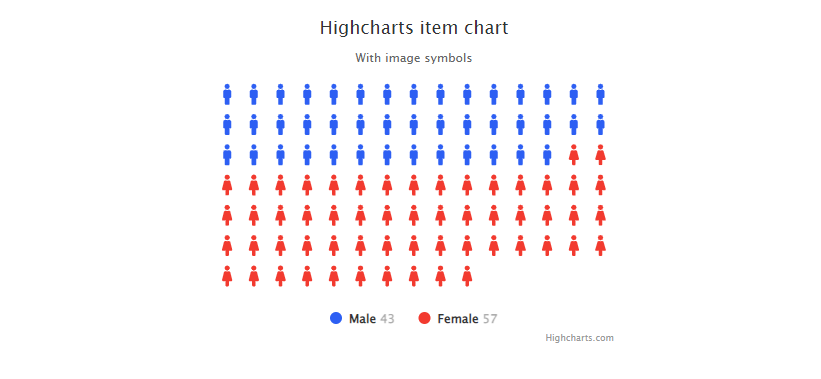
- property item: ItemOptions | None
General options to apply to all Item series types.
An item chart is an infographic chart where a number of items are laid out in either a rectangular or circular pattern. It can be used to visualize counts within a group, or for the circular pattern, typically a parliament.
The circular layout has much in common with a pie chart. Many of the item series options, like
center,sizeand data label positioning, are inherited from thePlotOptions.pie()series and don’t apply for rectangular layouts.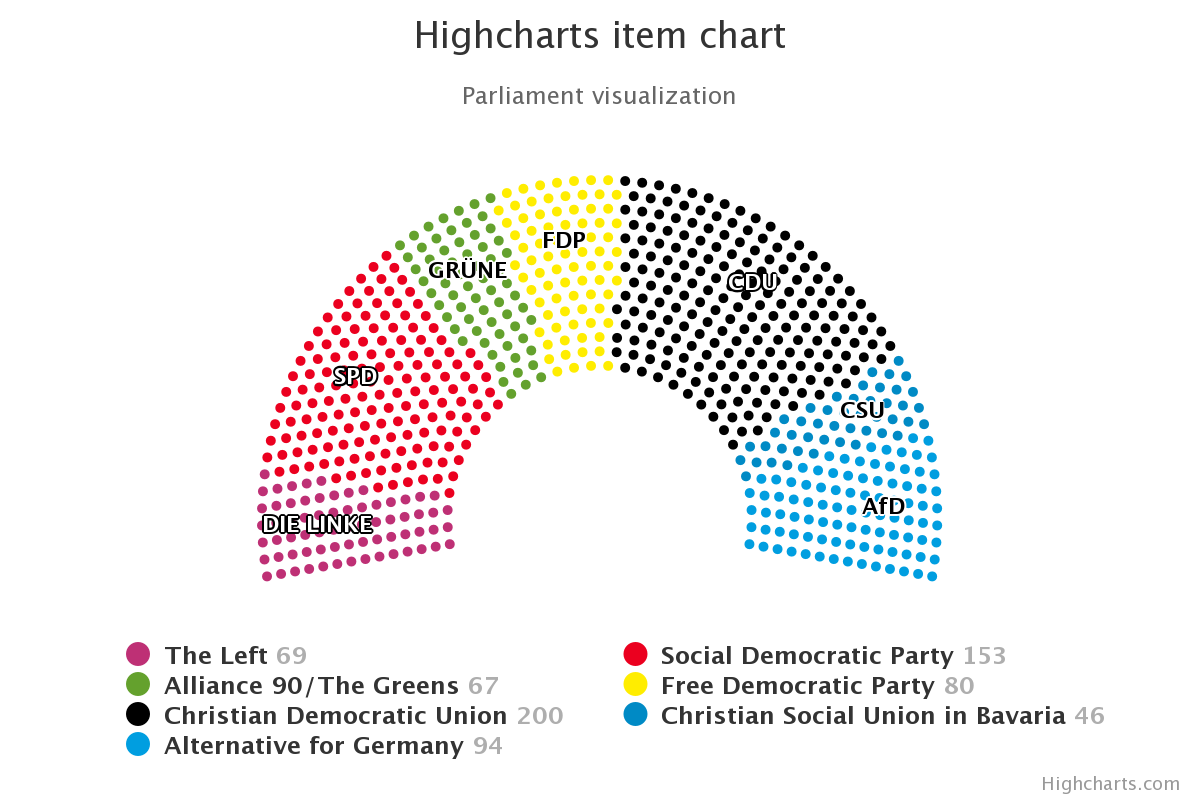
- Return type:
ItemOptionsorNone
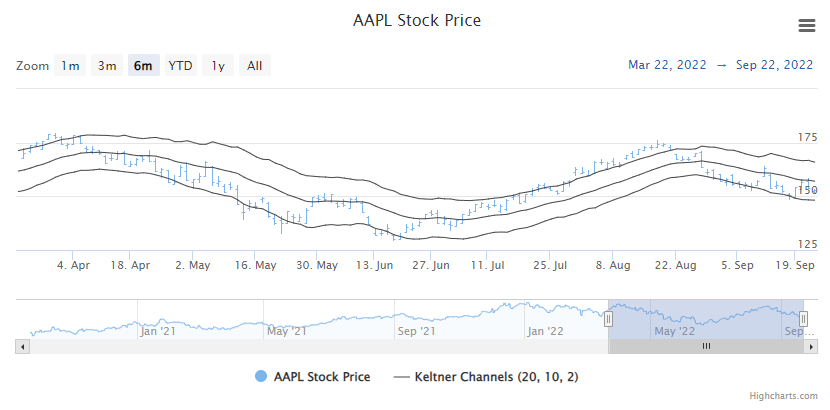
- property keltnerchannels: KeltnerChannelsOptions | None
General options to configure Keltner Channels indicator.
- Return type:
KeltnerChannelsOptionsorNone
- property klinger: KlingerOptions | None
General options to configure a Klinger Oscillator, used to determine the long-term trend of money flow while remaining sensitive enough to detect short-term fluctuations.
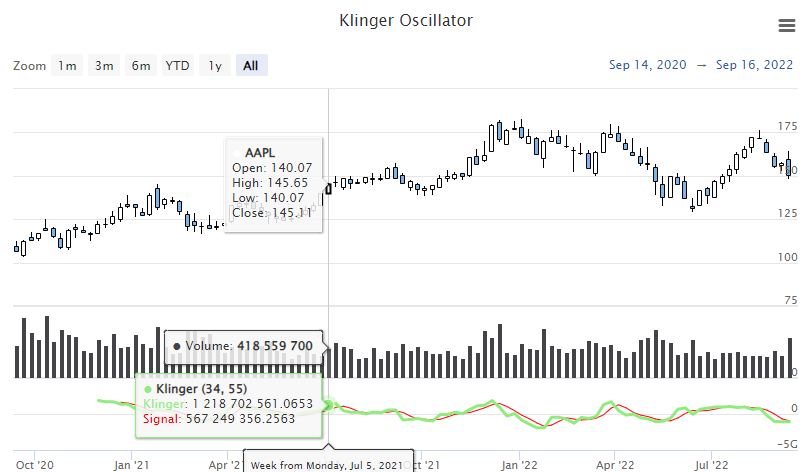
- Return type:
KlingerOptionsorNone
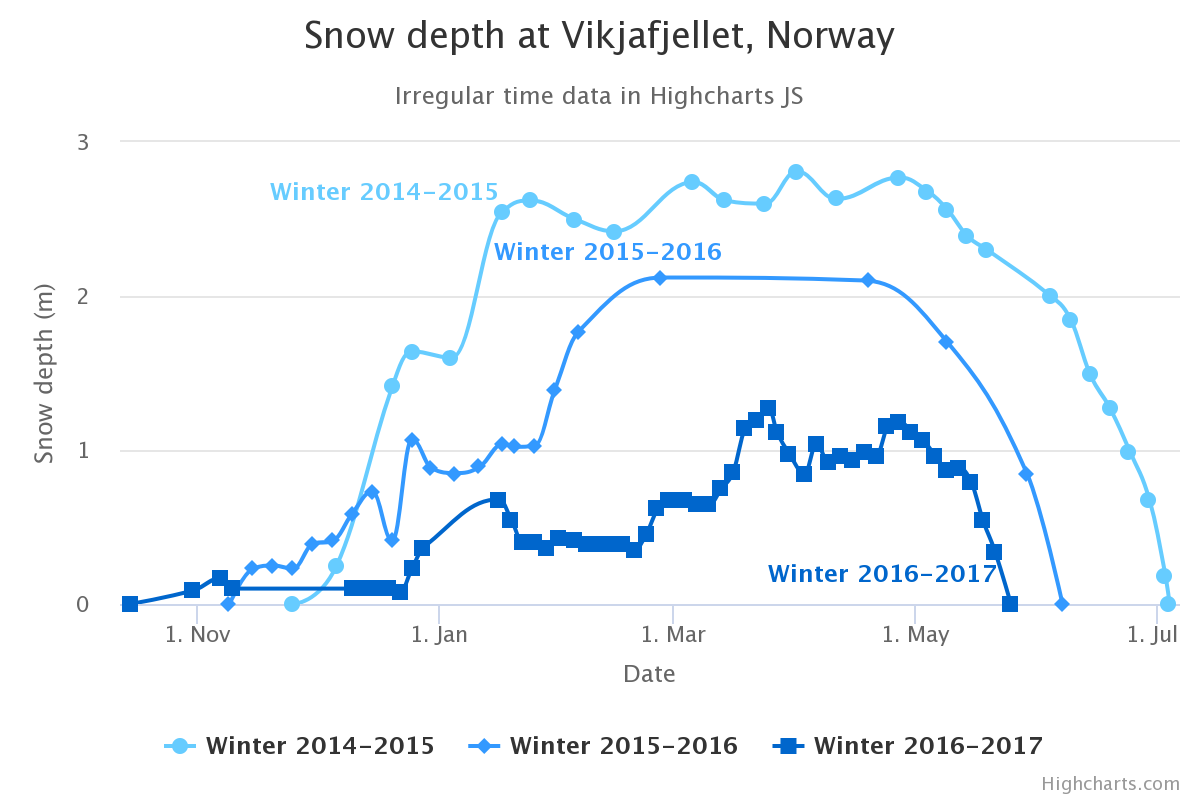
- property line: LineOptions | None
General options to apply to all Line series types.
A line series displays information as a series of data points connected by straight line segments.
- Return type:
LineOptionsorNone
- property linearregression: LinearRegressionOptions | None
General options to configure a Linear Regression indicator, which calculates a linear regression for a given set of values.
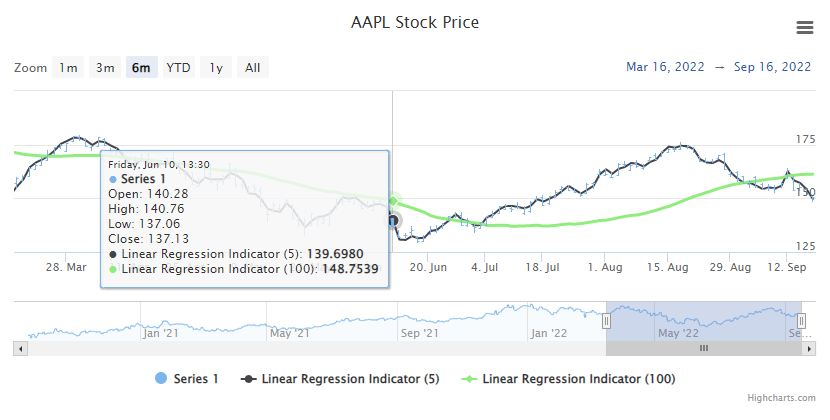
- Return type:
LinearRegressionOptionsorNone
- property linearregressionangle: LinearRegressionAngleOptions | None
General options to configure a Linear Regression Angle indicator, which is a directional movement indicator which defines a trend at the moment of its birth and can be used to identify trend weakening.
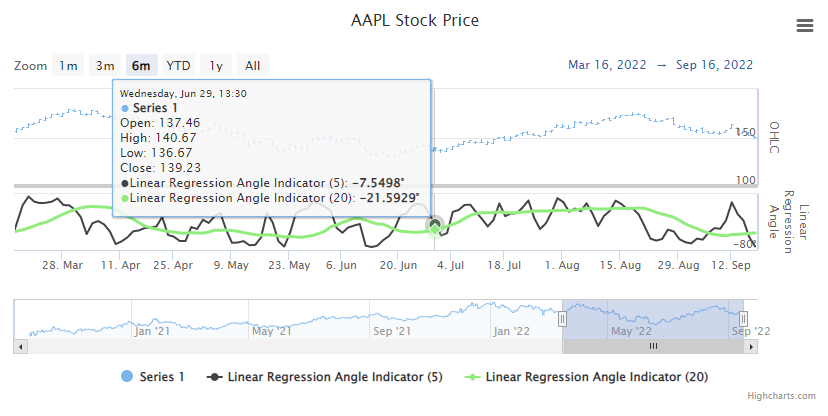
- Return type:
LinearRegressionAngleOptionsorNone
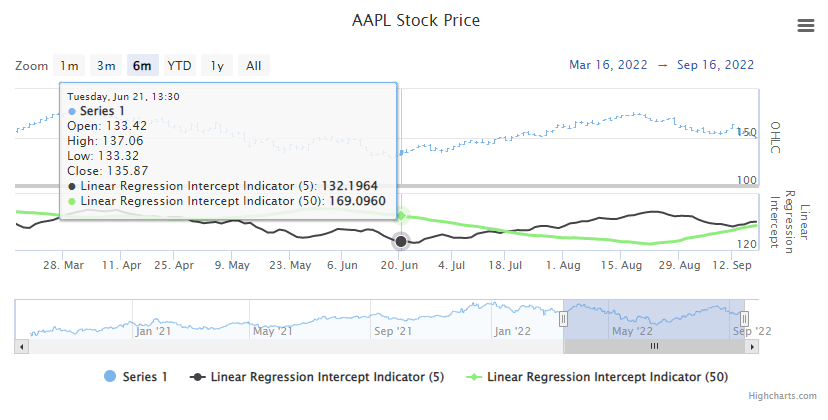
- property linearregressionintercept: LinearRegressionInterceptOptions | None
General options to configure a Linear Regression Intercept indicator.
- Return type:
LinearRegressionInterceptOptionsorNone
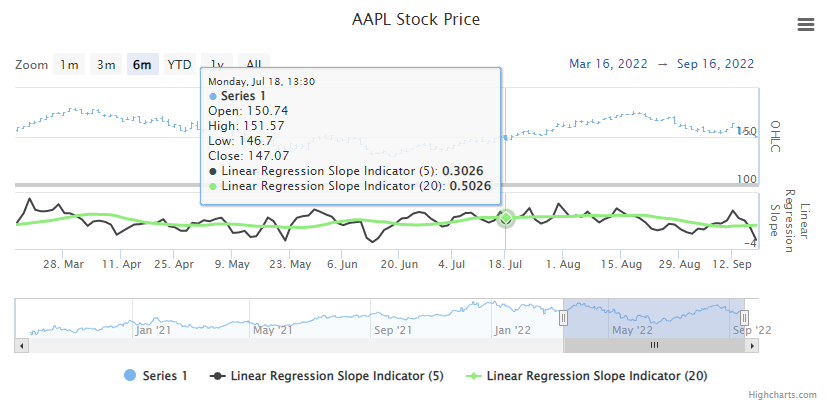
- property linearregressionslope: LinearRegressionSlopeOptions | None
General options to configure a Linear Regression Slope indicator.
- Return type:
LinearRegressionSlopeOptionsorNone
- property lollipop: LollipopOptions | None
General options to apply to all Lollipop series types.
The lollipop series is a carteseian series with a line anchored from the x axis and a dot at the end to mark the value.
Warning
Requires
highcharts-more.js,modules/dumbbell.js, andmodules/lollipop.jsto be loaded client-side.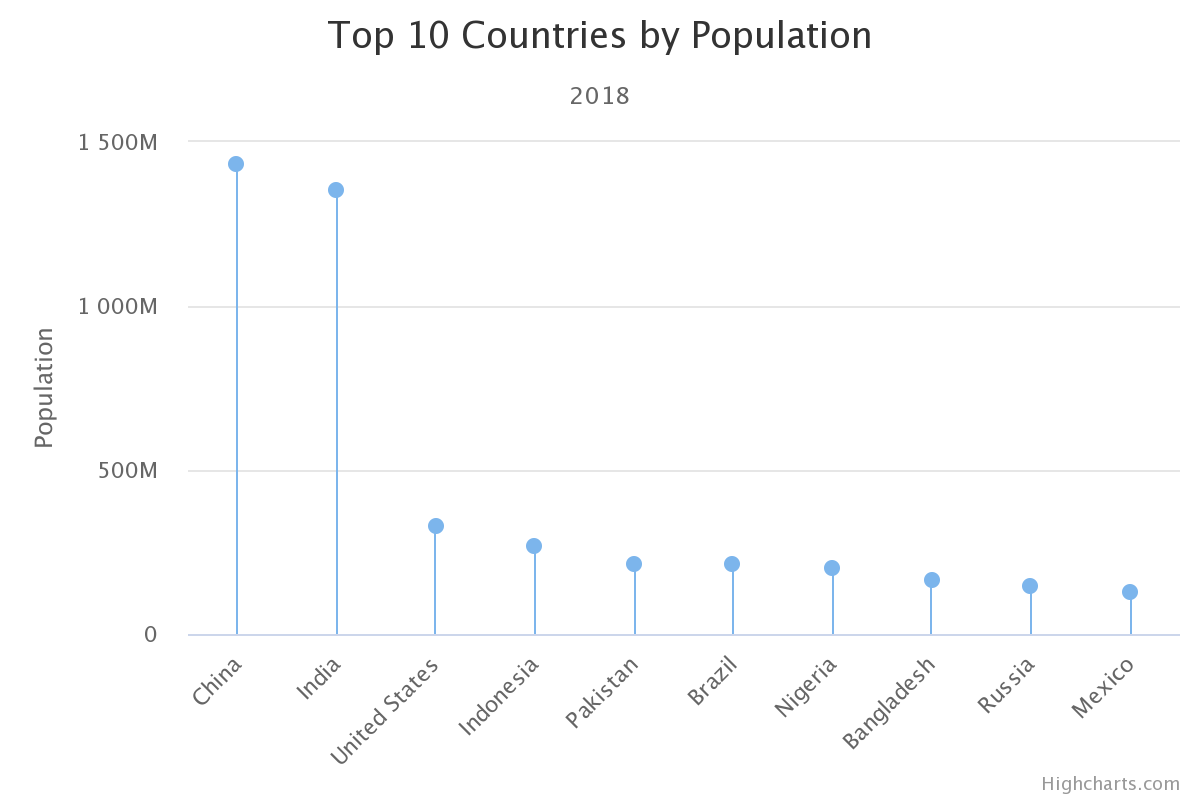
- Return type:
LollipopOptionsorNone
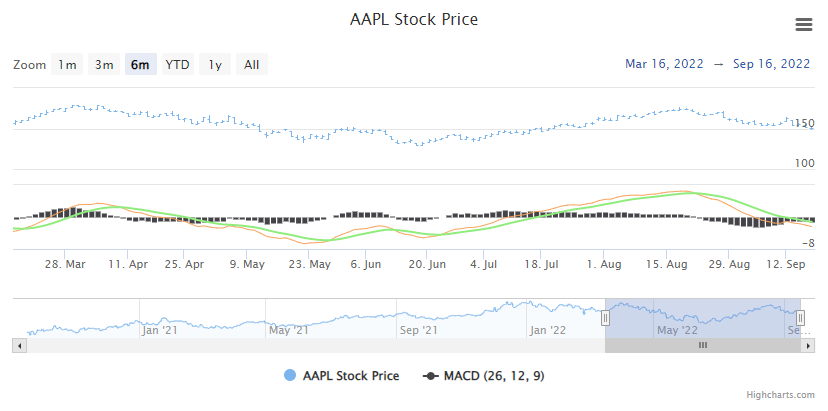
- property macd: MACDOptions | None
General options to configure a Moving Average Convergence/Divergence, a momentum indicator.
- Return type:
MACDOptionsorNone
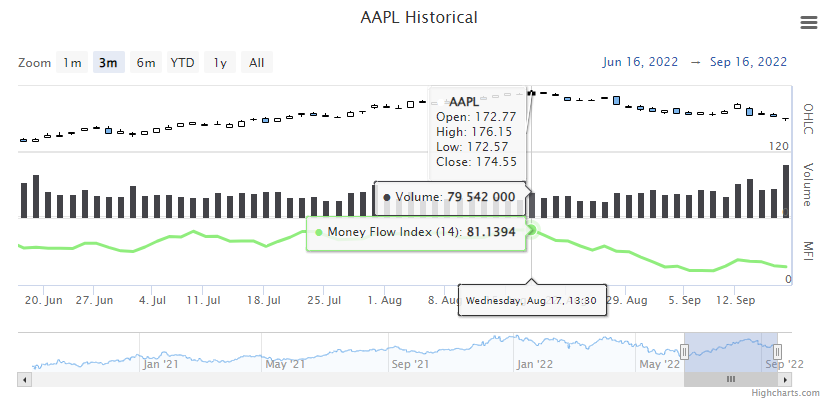
- property mfi: MFIOptions | None
General options to configure a Money Flow Index oscillator, which uses price and volume data to identify over-bought or over-sold signals in an asset.
- Return type:
MFIOptionsorNone
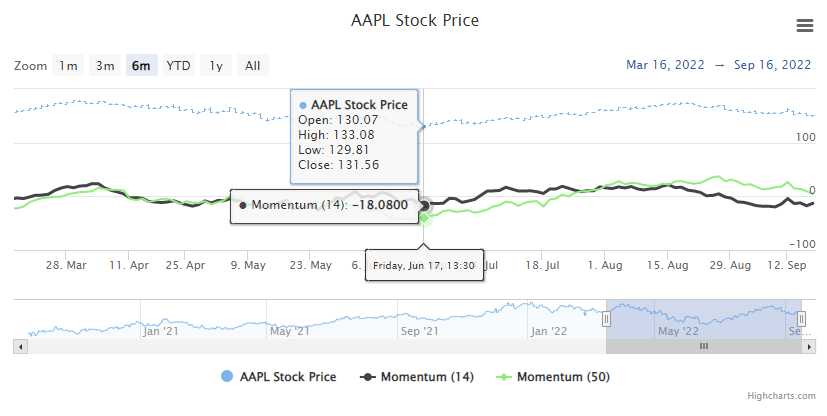
- property momentum: MomentumOptions | None
General options to configure a Momentum indicator.
- Return type:
MomentumOptionsorNone
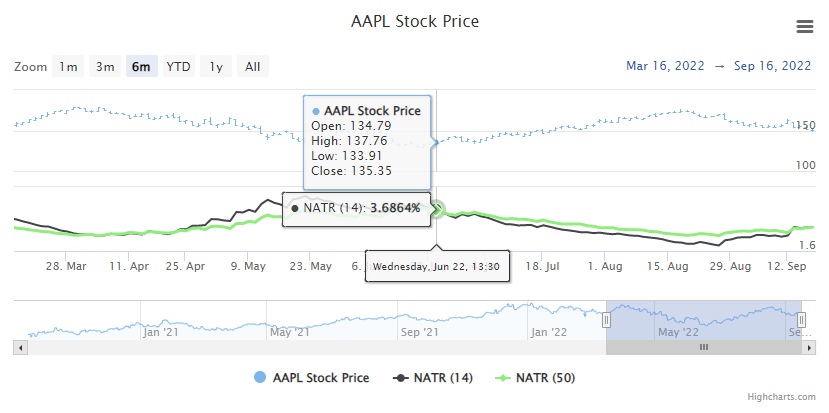
- property natr: NATROptions | None
General options to configure a Normalized Average True Range indicator.
- Return type:
NATROptionsorNone
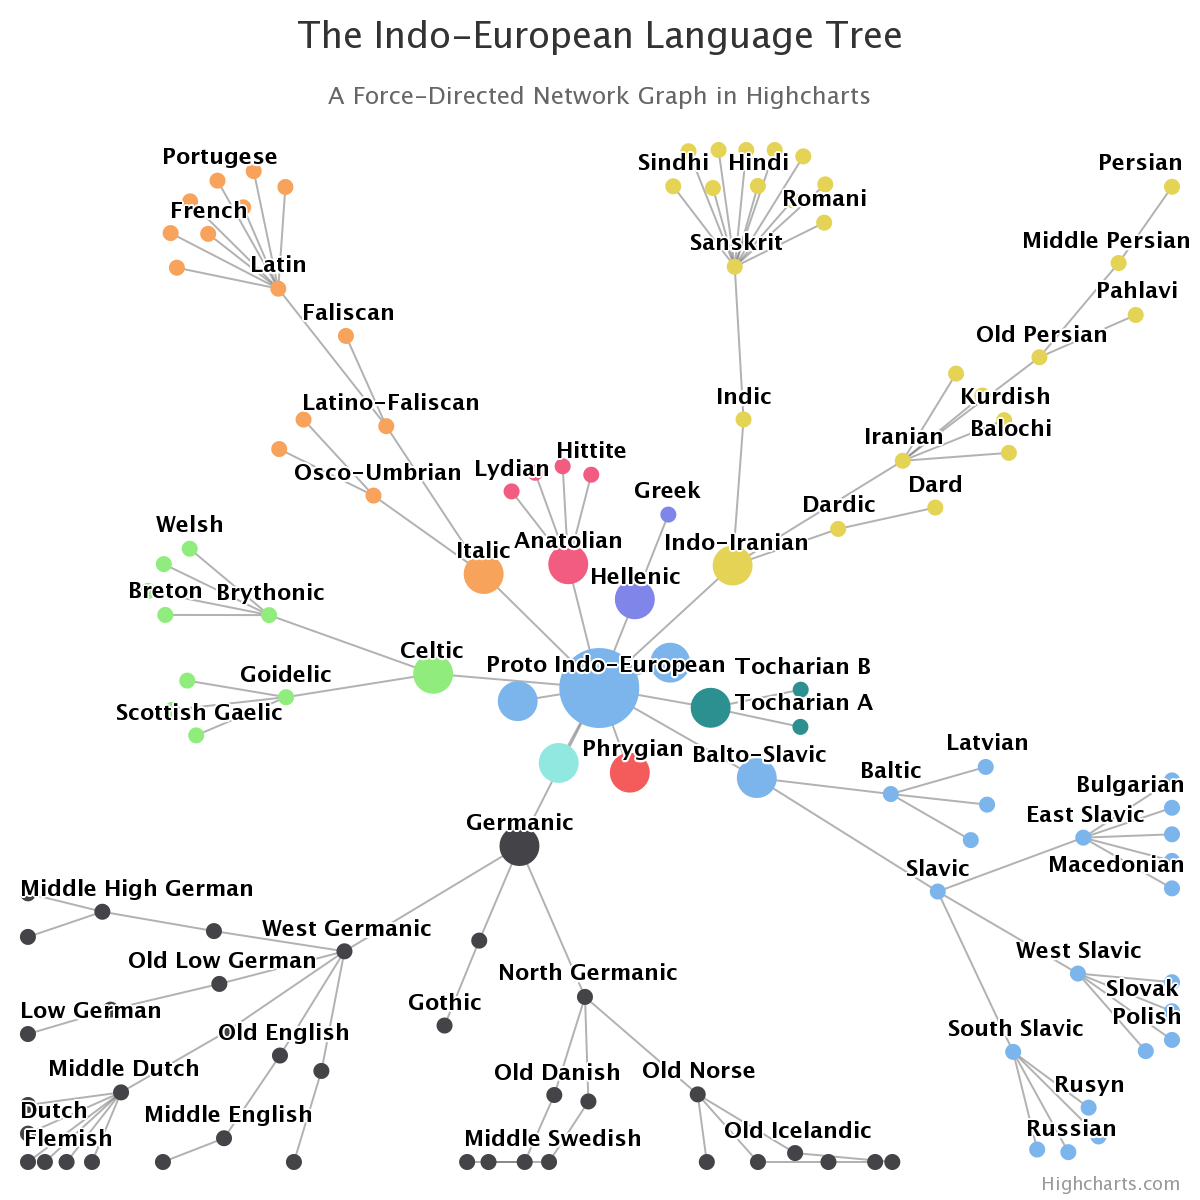
- property networkgraph: NetworkGraphOptions | None
General options to apply to all Network Graph series types.
A network graph is a type of relationship chart, where connnections (links) attract nodes (points) and other nodes repulse each other.
- Return type:
NetworkGraphOptionsorNone
- property obv: OBVOptions | None
General options to configure a Normalized Average True Range indicator.
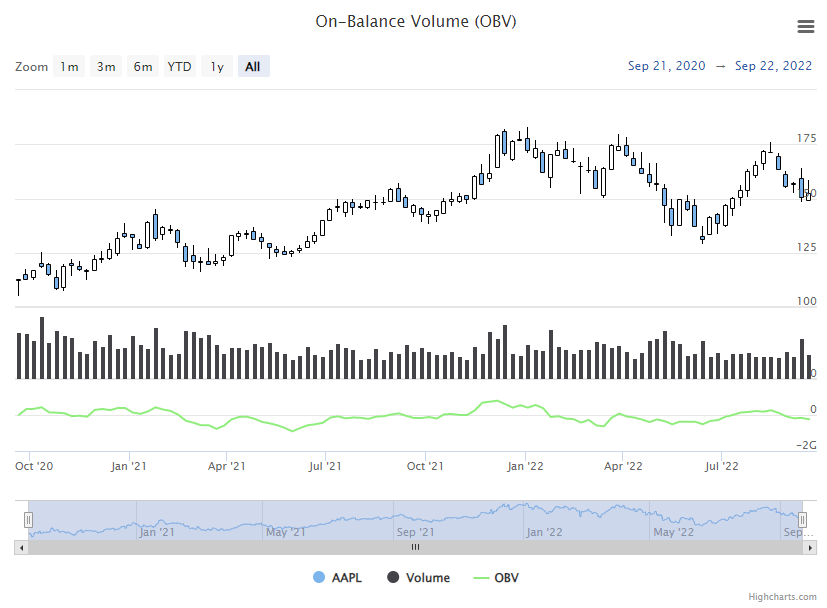
- Return type:
OBVOptionsorNone
- property ohlc: OHLCOptions | None
General options to apply to a OHLC series type. An OHLC chart is a sub-type of HLC charts which displays the open, high, low, and close values of an asset over time.
- Return type:
OHLCOptionsorNone
- property organization: OrganizationOptions | None
General options to apply to all Organization series types.
An organization chart is a diagram that shows the structure of an organization and the relationships and relative ranks of its parts and positions.
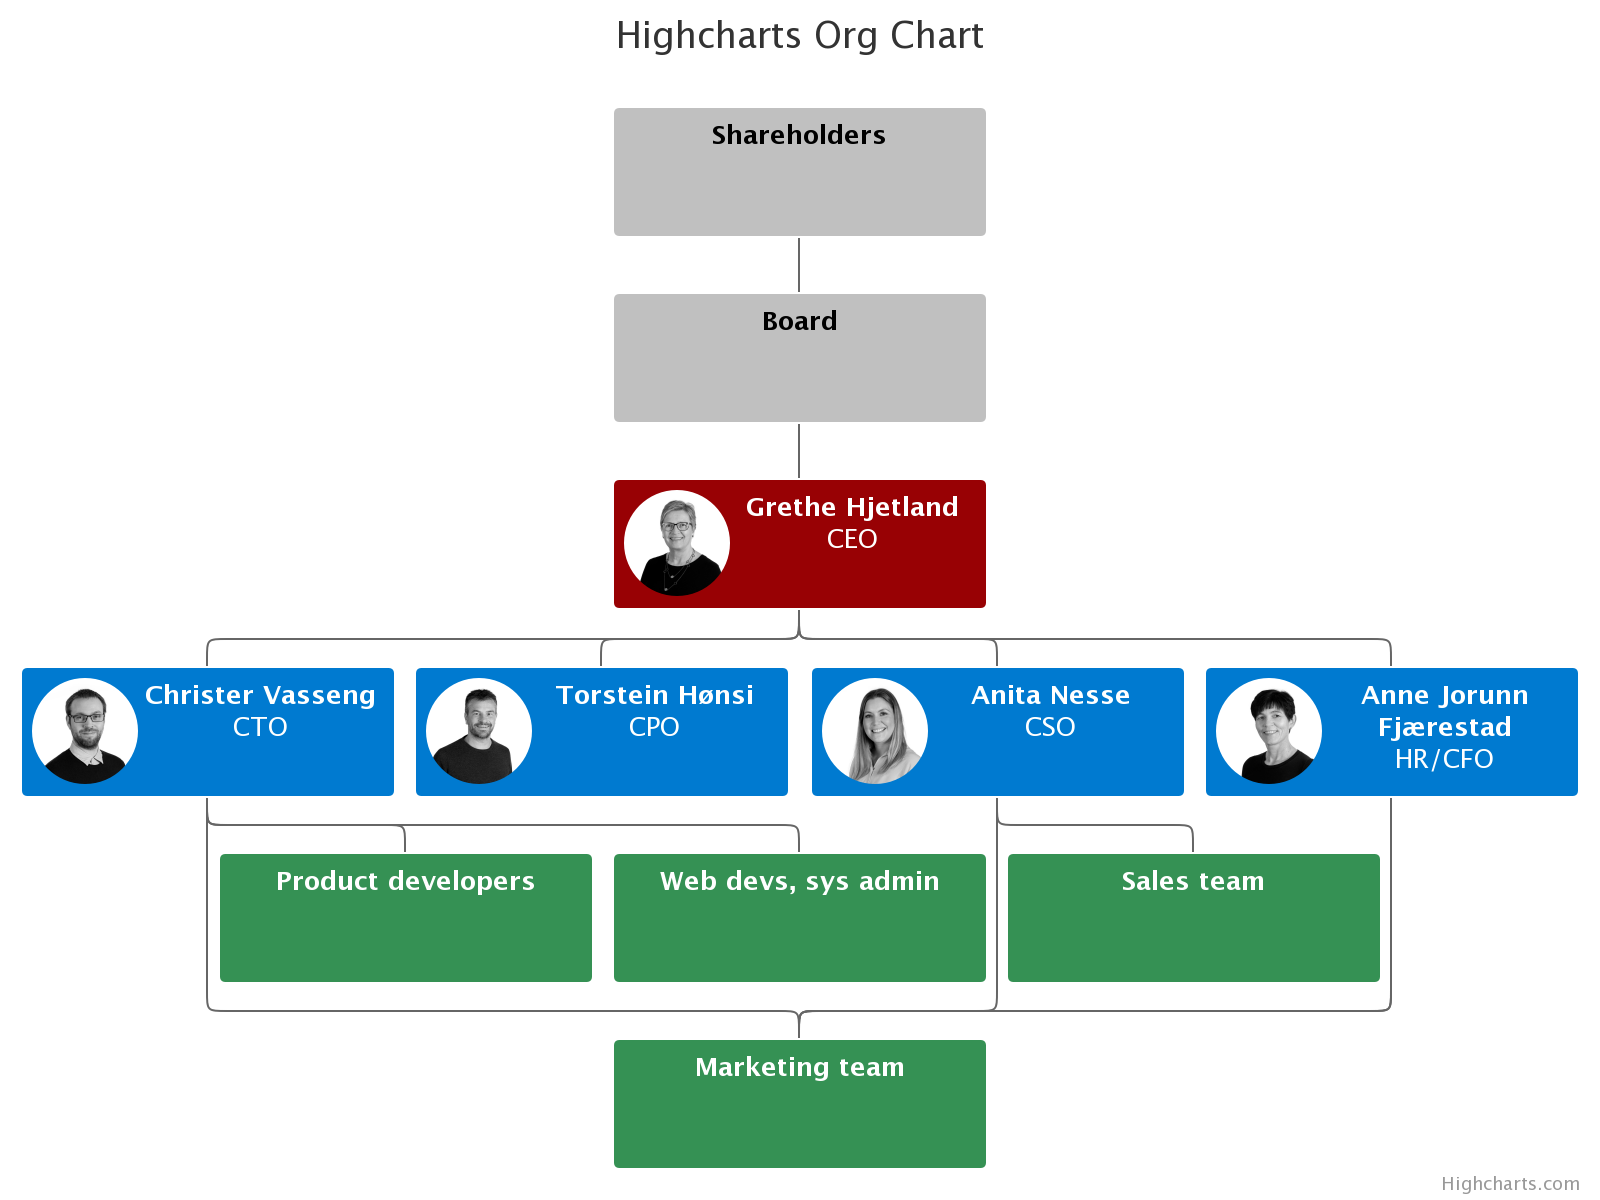
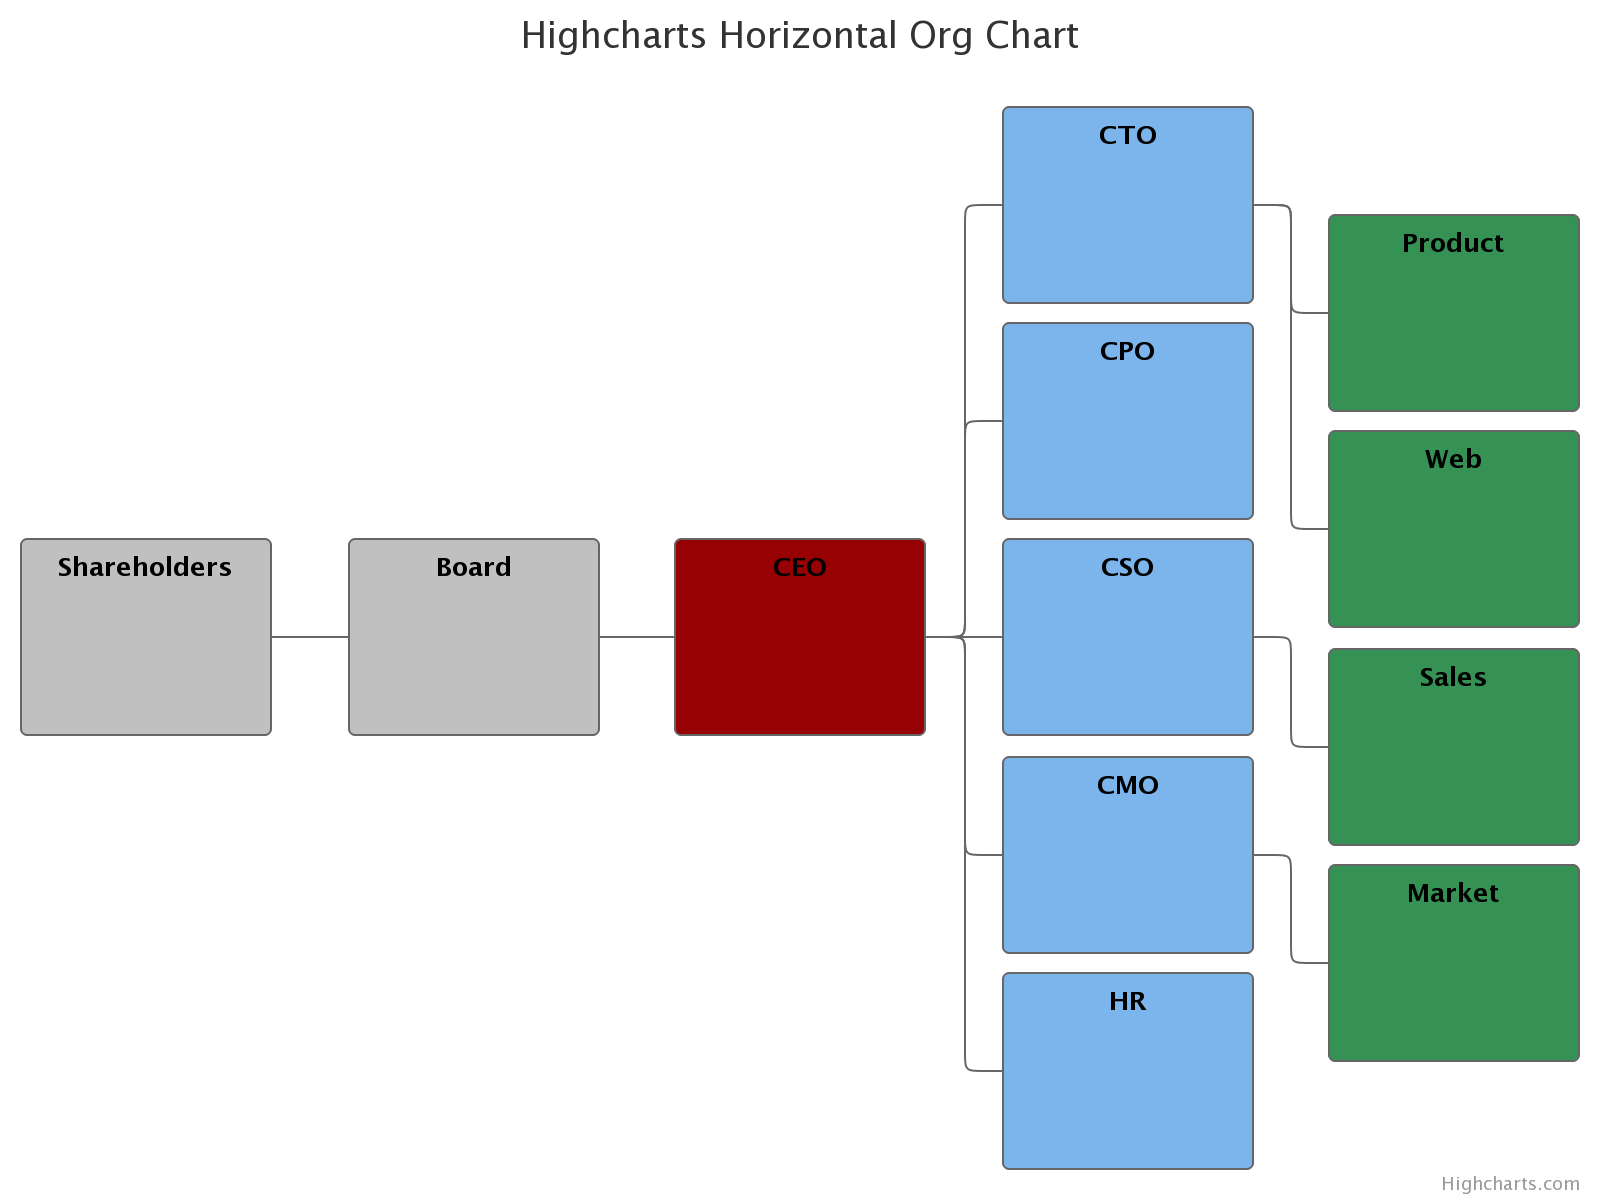
- Return type:
OrganizationOptionsorNone
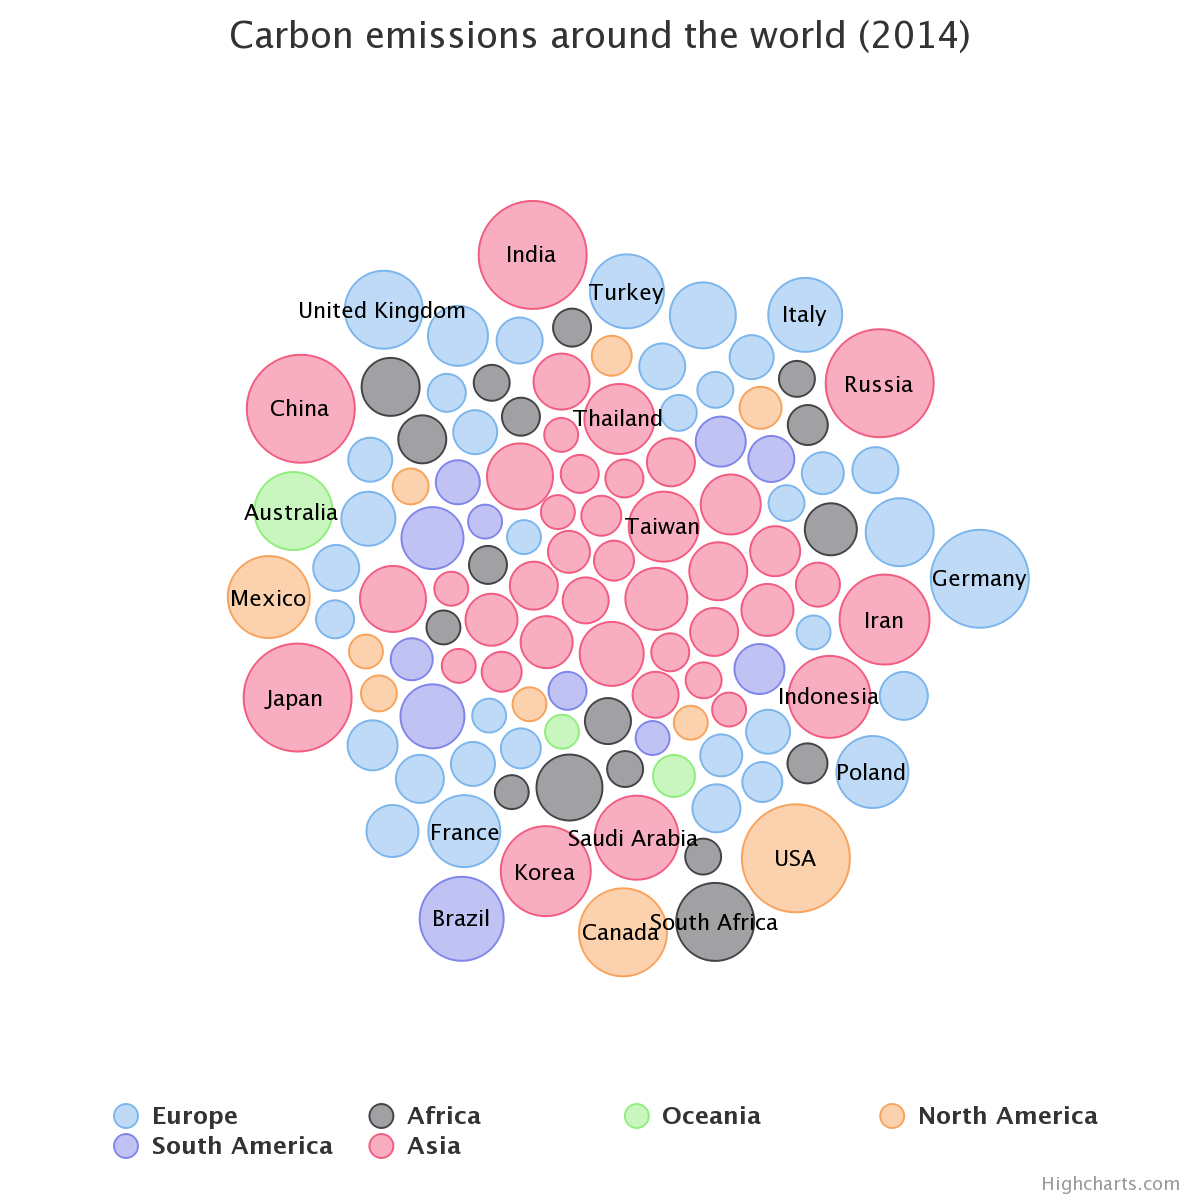
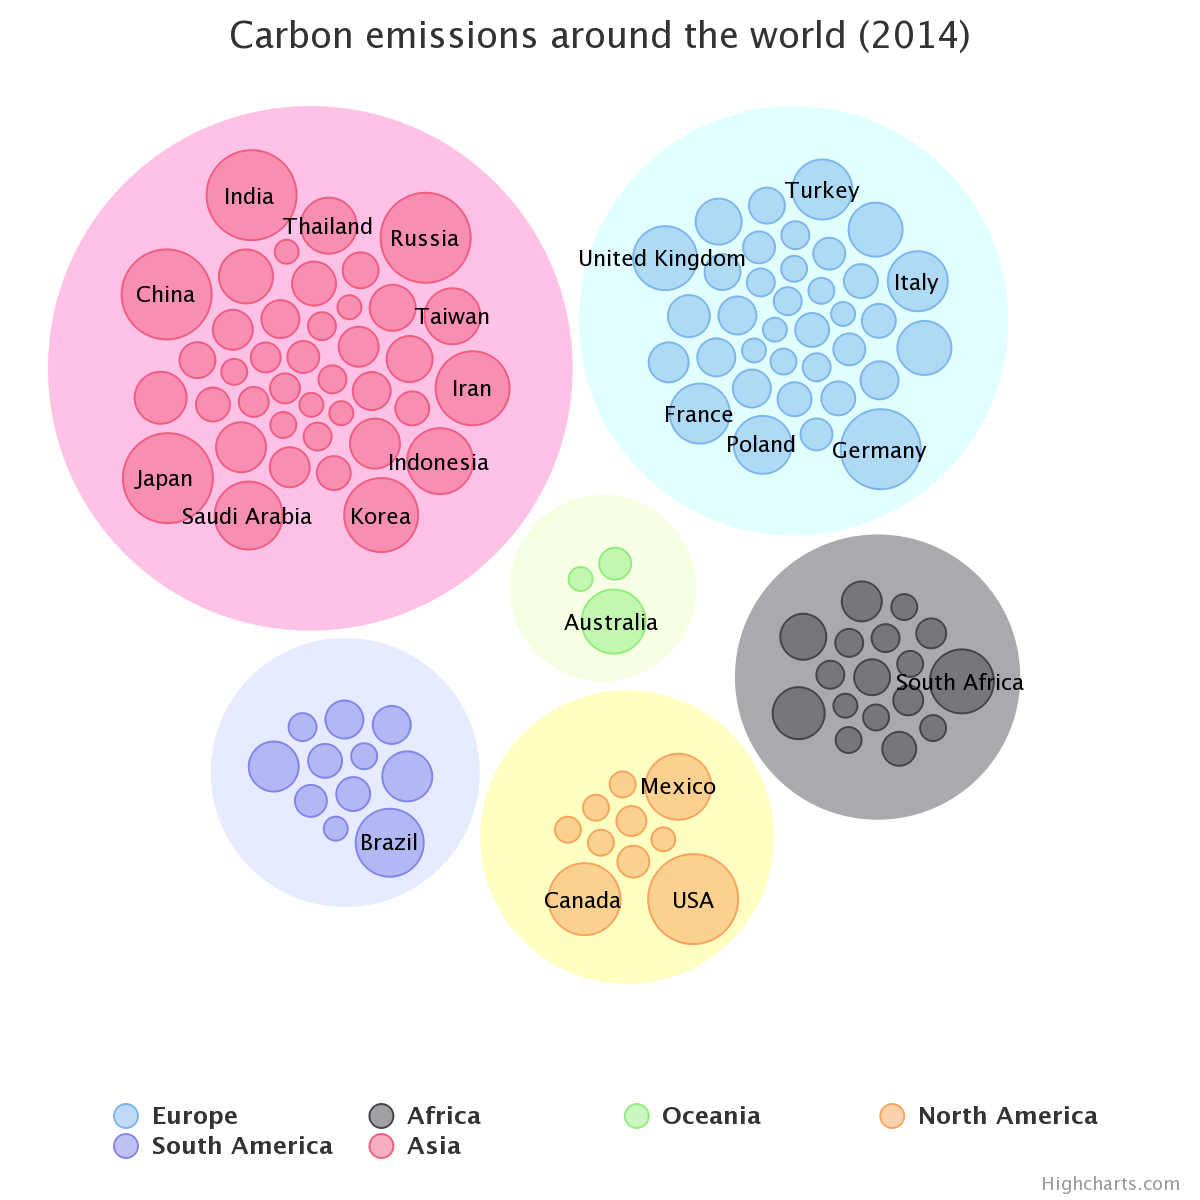
- property packedbubble: PackedBubbleOptions | None
General options to apply to all Packed Bubble series types.
A packed bubble series is a two dimensional series type, where each point renders a value in X, Y position. Each point is drawn as a bubble where the bubbles don’t overlap with each other and the radius of the bubble relates to the value.
- Return type:
PackedBubbleOptionsorNone
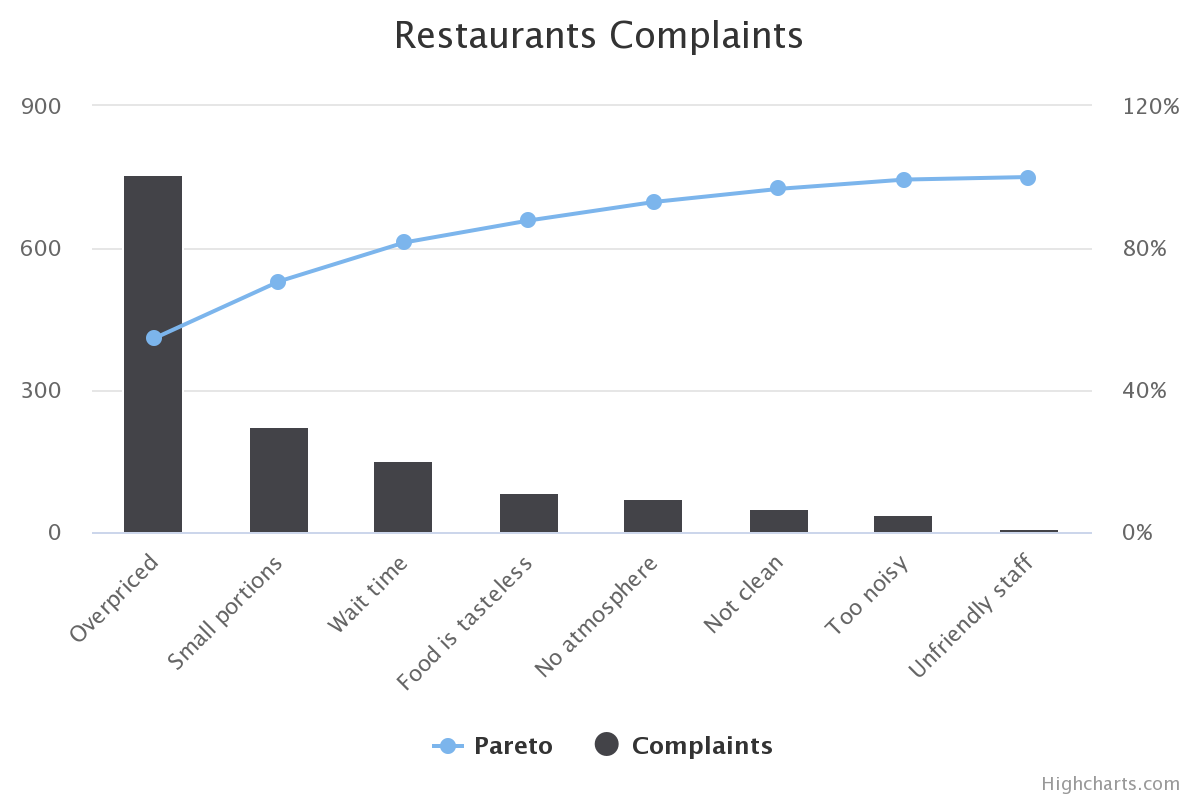
- property pareto: ParetoOptions | None
General options to apply to all Pareto series types.
A pareto diagram is a type of chart that contains both bars and a line graph, where individual values are represented in descending order by bars, and the cumulative total is represented by the line.
- Return type:
ParetoOptionsorNone
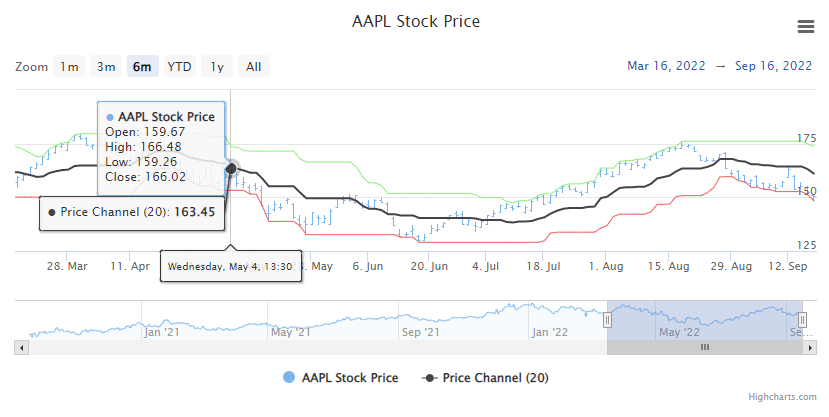
- property pc: PCOptions | None
General options for a Price Channel indicator.
- Return type:
PCOptionsorNone
- property pictorial: PictorialOptions | None
General options to apply to all Pictorial series types.
A pictorial series uses vector images to represent the data, with the data’s shape determined by the
pathparameter.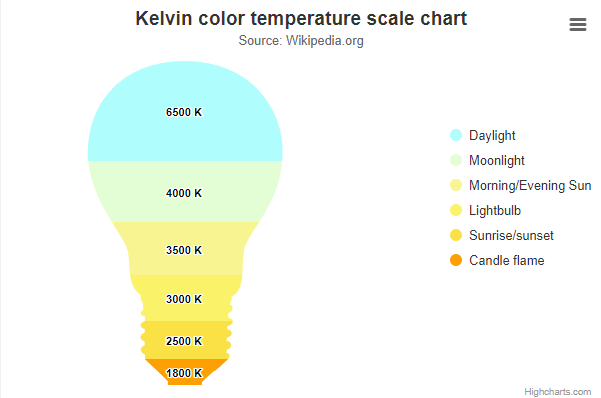
- Return type:
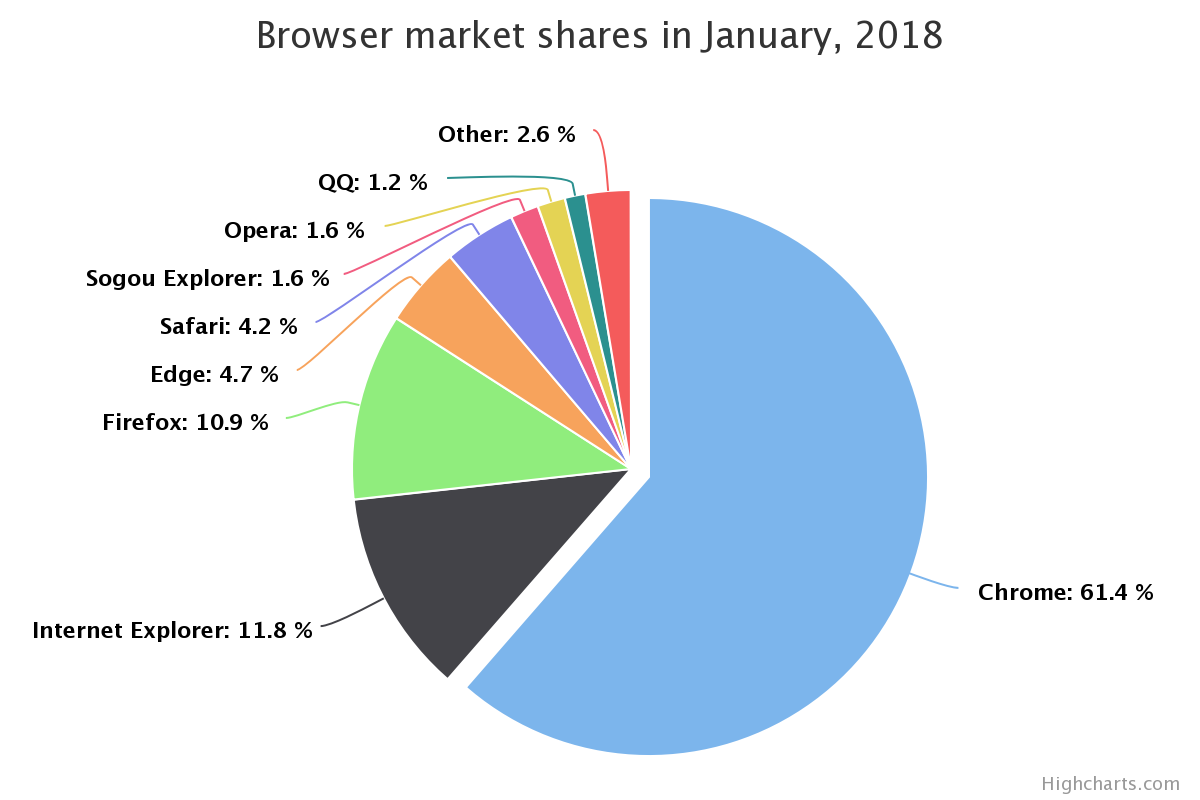
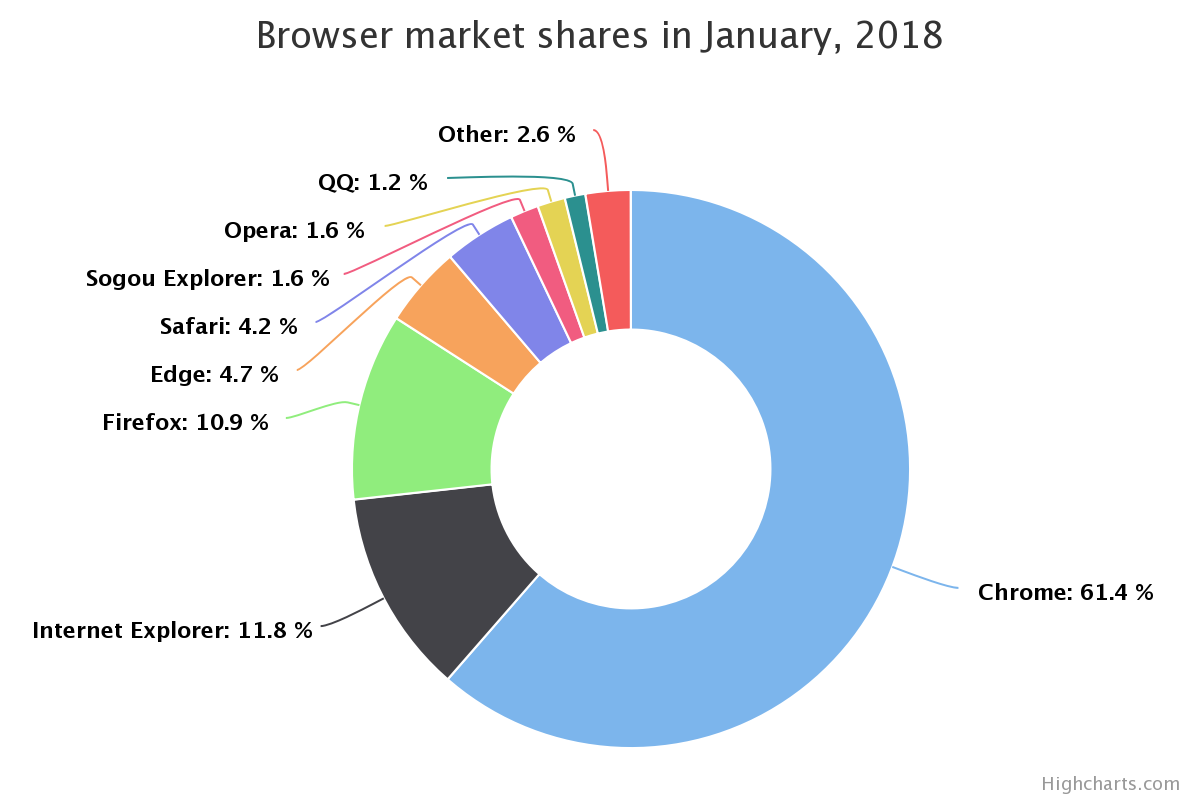
- property pie: PieOptions | None
General options to apply to all Pie series types.
A pie chart is a circular graphic which is divided into slices to illustrate numerical proportion.
- Return type:
PieOptionsorNone
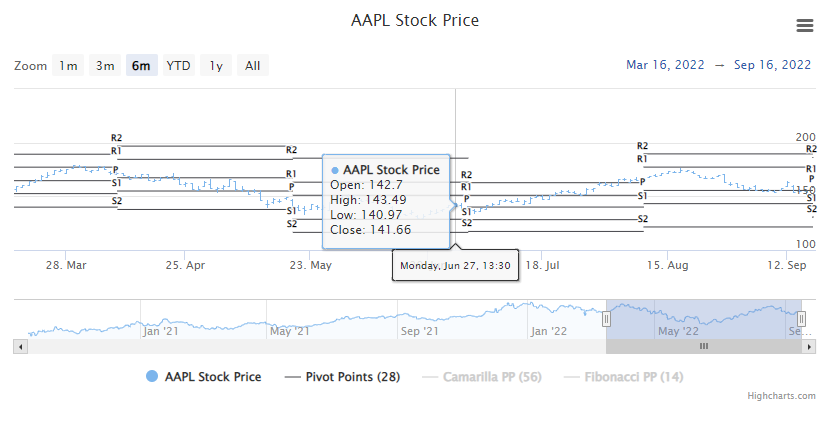
- property pivotpoints: PivotPointsOptions | None
General options to configure a Pivot Points indicator, which are typically used to identify trends and reversals in intraday trading.
- Return type:
PivotPointsOptionsorNone
- property polygon: PolygonOptions | None
General options to apply to all Polygon series types.
A polygon series can be used to draw any freeform shape in the cartesian coordinate system. A fill is applied with the
PolygonOptions.color()setting, and stroke is applied throughPolygonOptions.line_width()andPolygonOptions.line_color().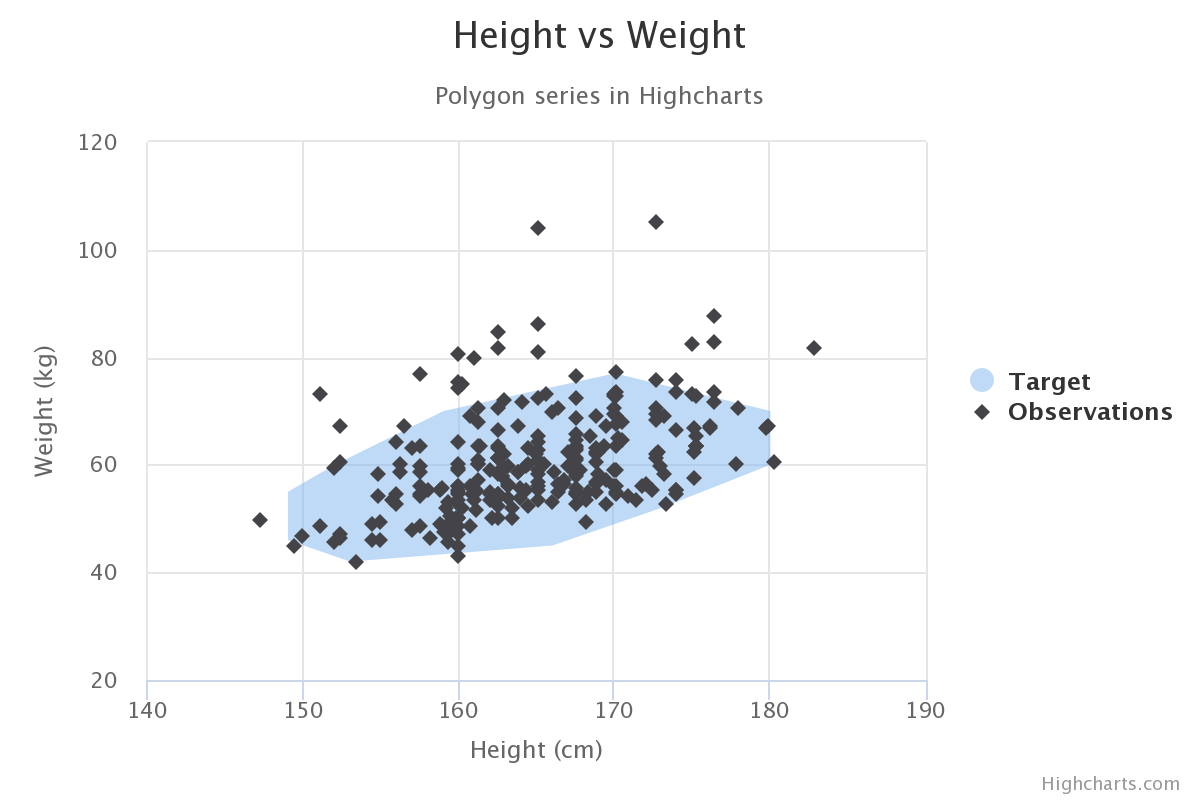
- Return type:
PolygonOptionsorNone
- property ppo: PPOOptions | None
General options to configure a Percentage Price Oscillator, which shows the relationship between two moving averages in percentage terms.
Note
Defaults to comparing a 26-period and 12-period exponential moving average, though this can be adjusted using
params.period <highcharts_stock.options.plot_options.oscillators.PPOOptions.params().
- Return type:
PPOOptionsorNone
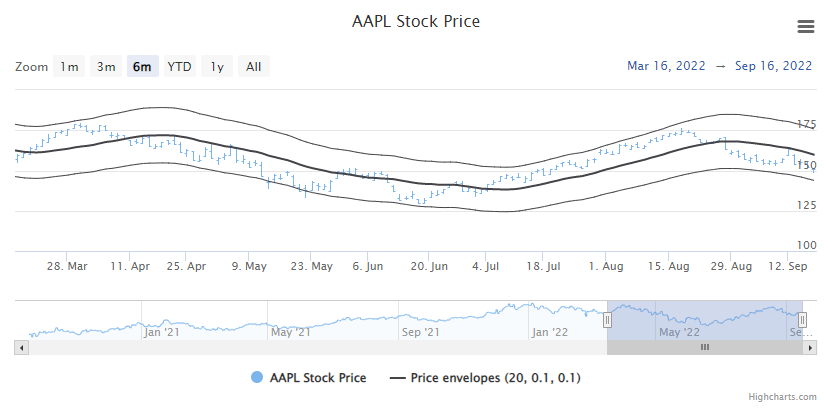
- property priceenvelopes: PriceEnvelopesOptions | None
General options for for Price Envelopes, a technical indicator based on simple moving averages.
- Return type:
PriceEnvelopesOptionsorNone
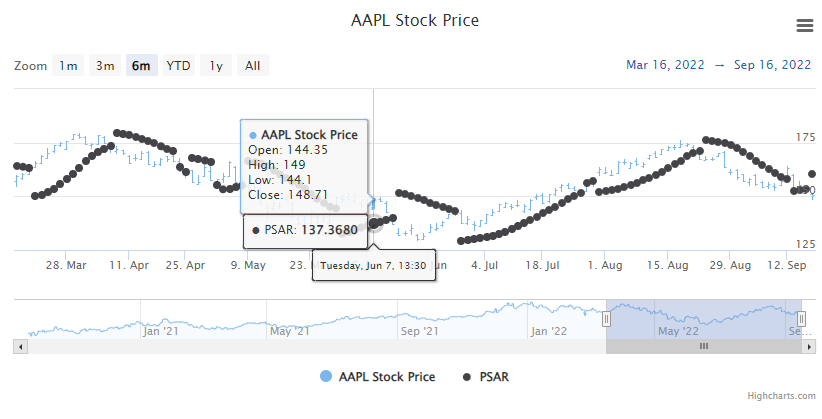
- property psar: PSAROptions | None
General options to configure a Parabolic SAR indicator, which can be used to determine the direction in which a trend is moving.
- Return type:
PSAROptionsorNone
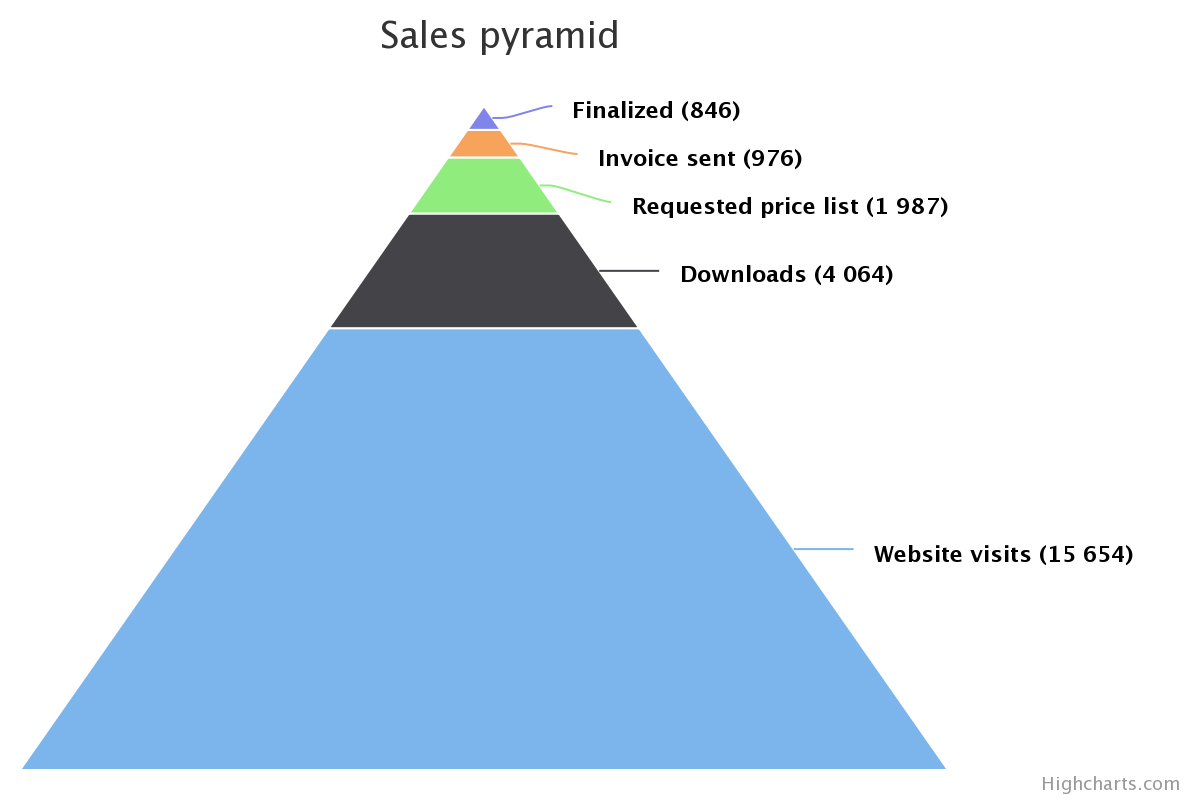
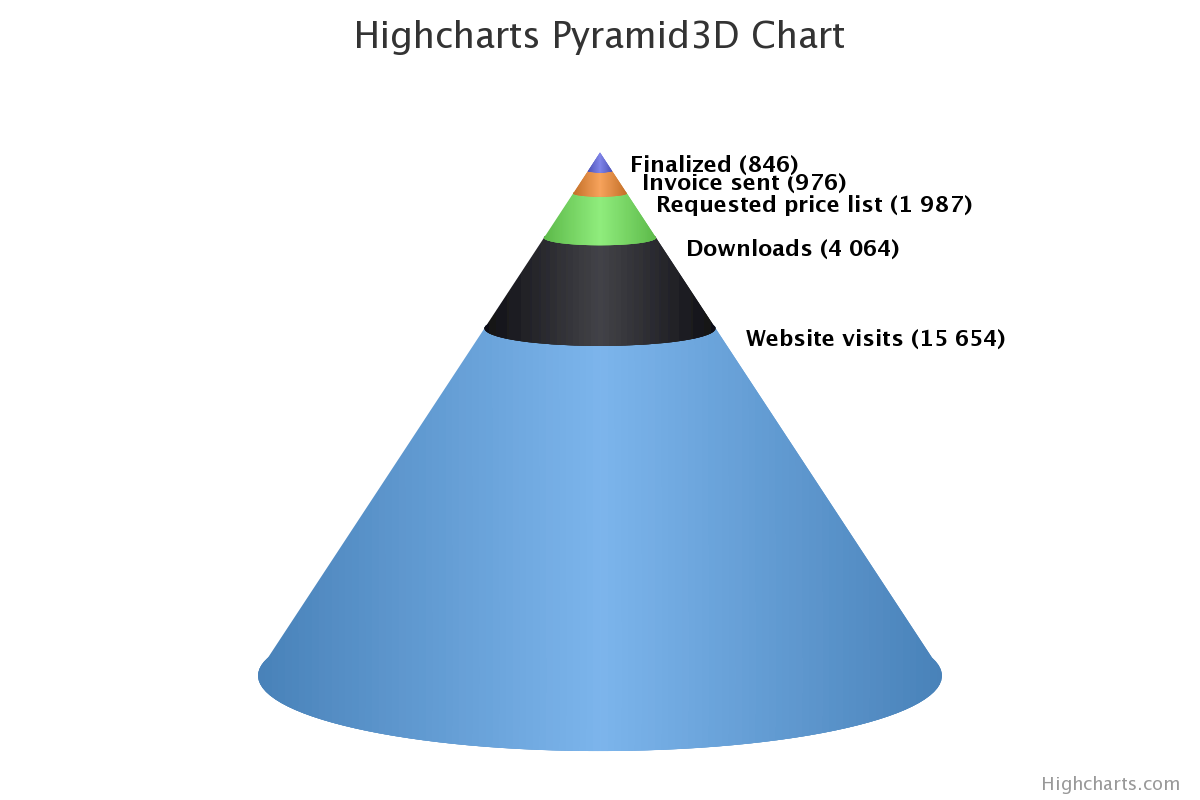
- property pyramid: PyramidOptions | None
General options to apply to all Pyramid series types.
A pyramid series is a special type of funnel, without neck and reversed by default.
- Return type:
PyramidOptionsorNone
- property pyramid_3d: Pyramid3DOptions | None
General options to apply to all Pyramid 3D series types.
A pyramid 3d series is a special type of funnel, without neck and reversed by default.
- Return type:
Pyramid3DOptionsorNone
- property roc: ROCOptions | None
General options to configure a Rate of Change indicator.
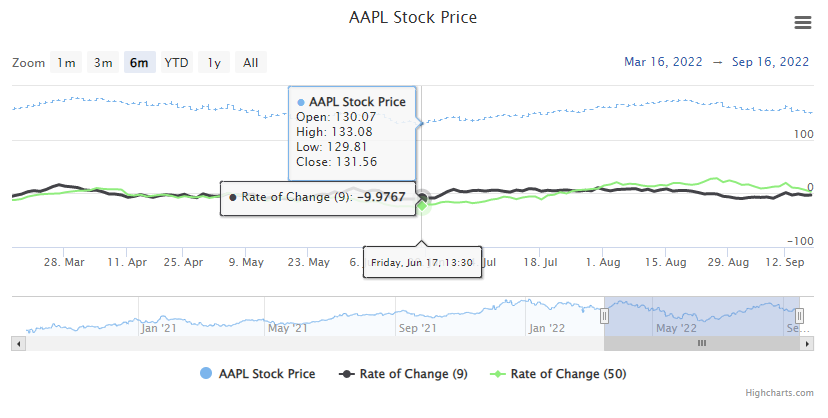
The indicator value for each point is calculated using:
(C - Cn)/ Cn * 100
where:
Cis the close value of the point of the same x in the linked series, andCnis the close value of the pointnperiods ago, wherenis determined via.params.period
- Return type:
ROCOptionsorNone
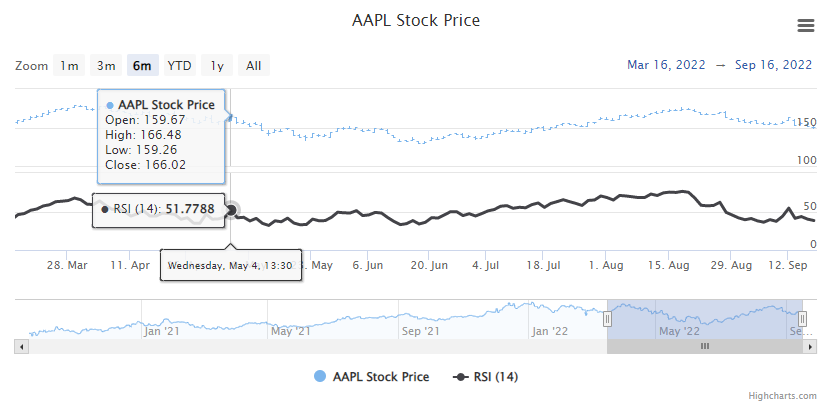
- property rsi: RSIOptions | None
General options to configure a Relative Strength Index, a momentum indicator that measures the speed and magnitude of recent value changes to evaluate over-valued or under-valued conditions.
- Return type:
RSIOptionsorNone
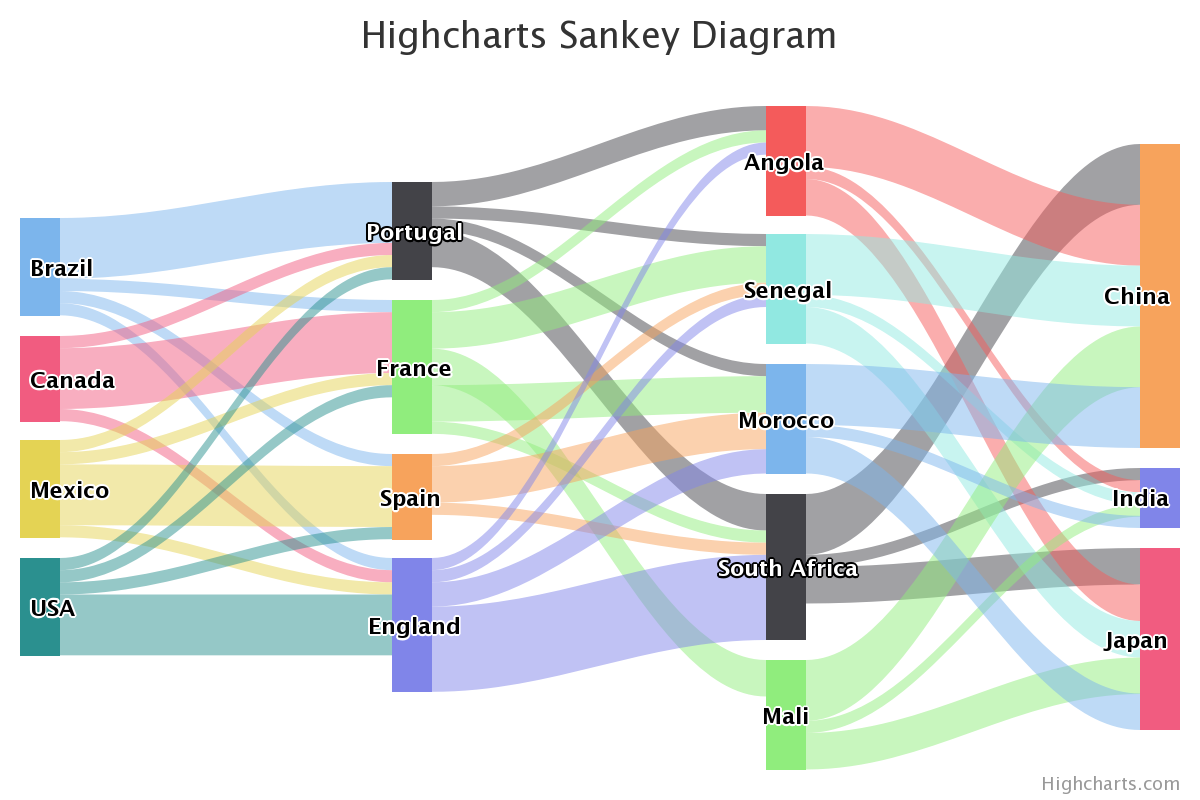
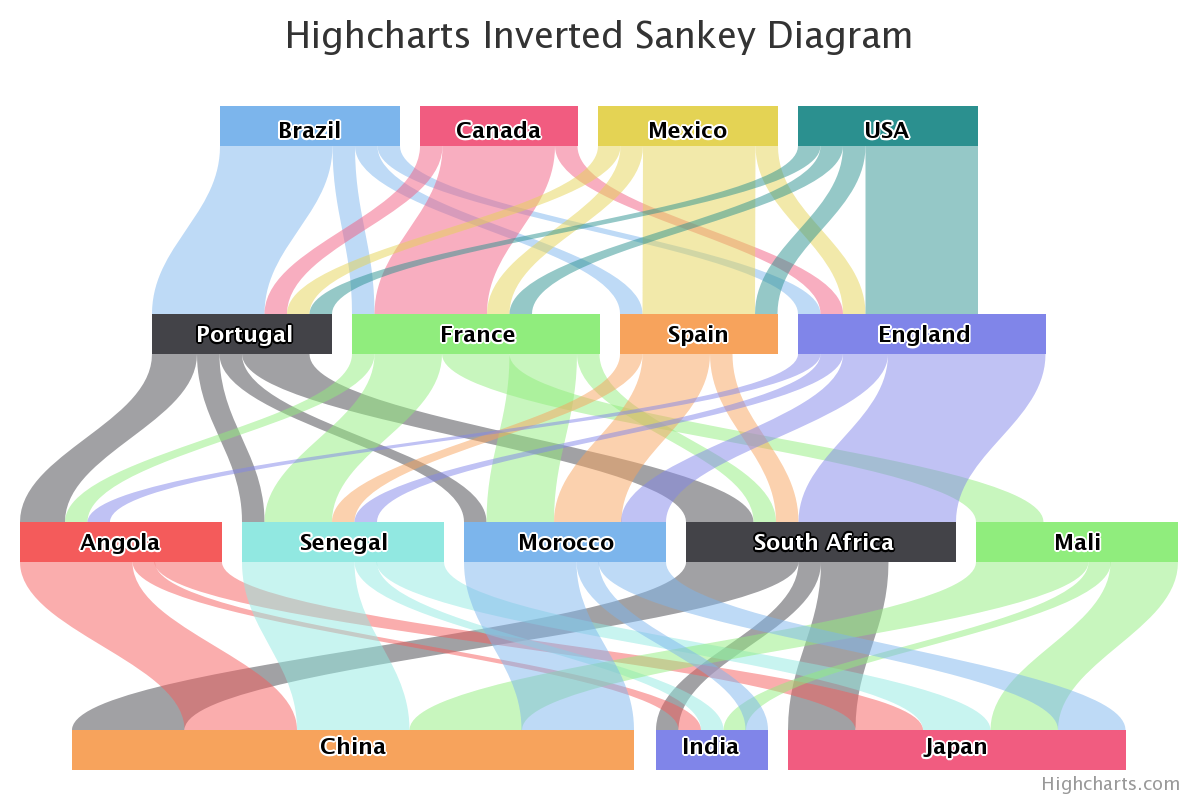
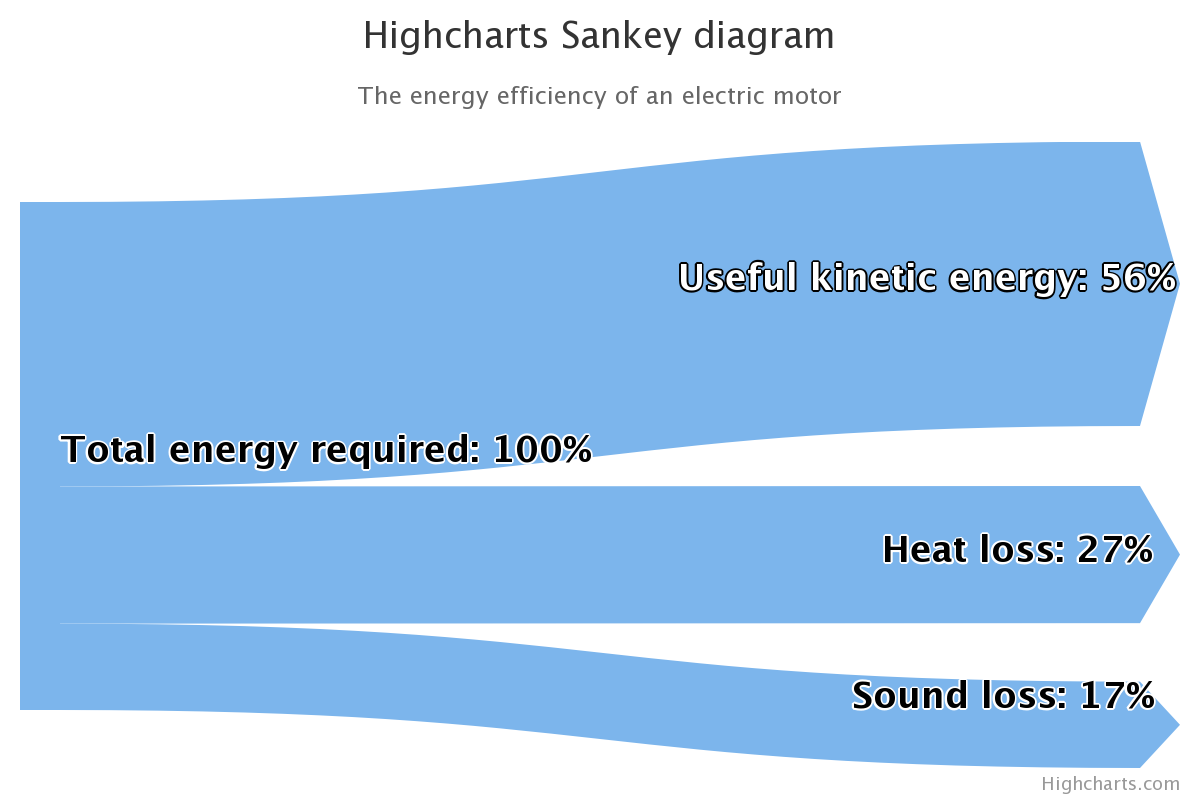
- property sankey: SankeyOptions | None
General options to apply to all Sankey series types.
A sankey diagram is a type of flow diagram, in which the width of the link between two nodes is shown proportionally to the flow quantity.
- Return type:
SankeyOptionsorNone
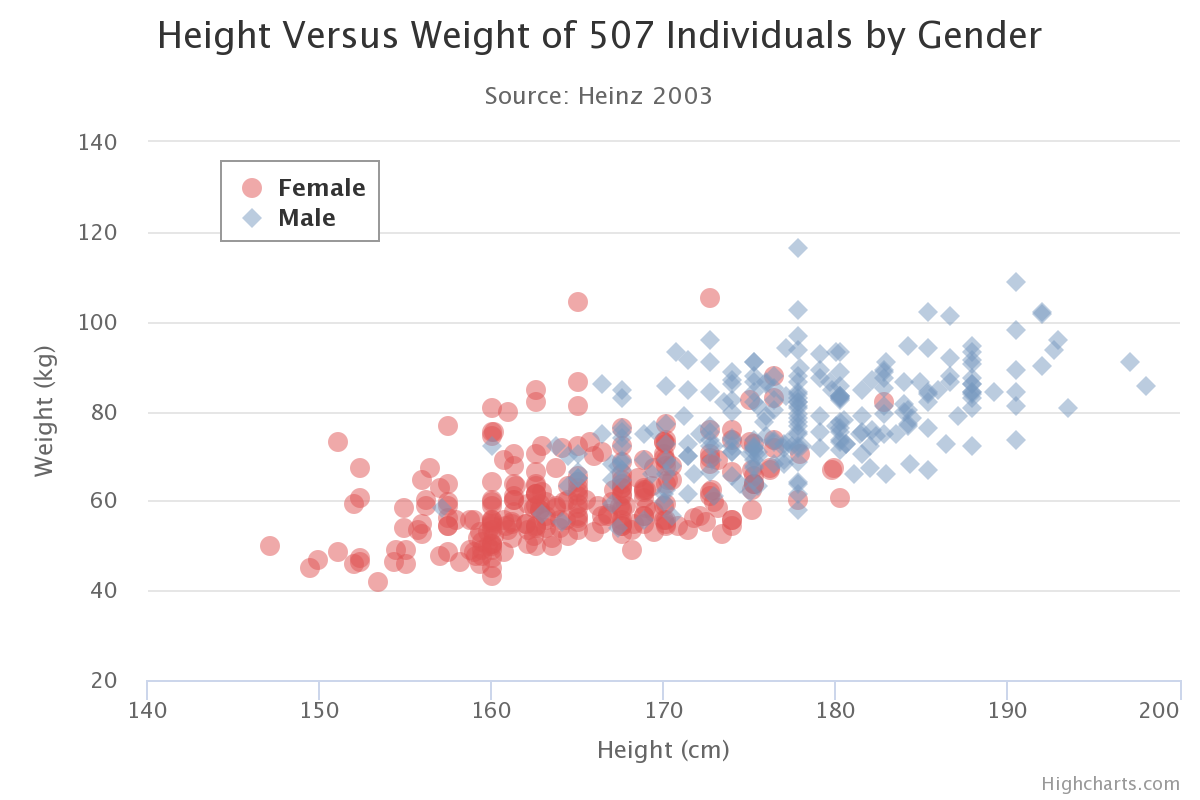
- property scatter: ScatterOptions | None
General options to apply to all Scatter series types.
A scatter plot uses cartesian coordinates to display values for two variables for a set of data.
- Return type:
ScatterOptionsorNone
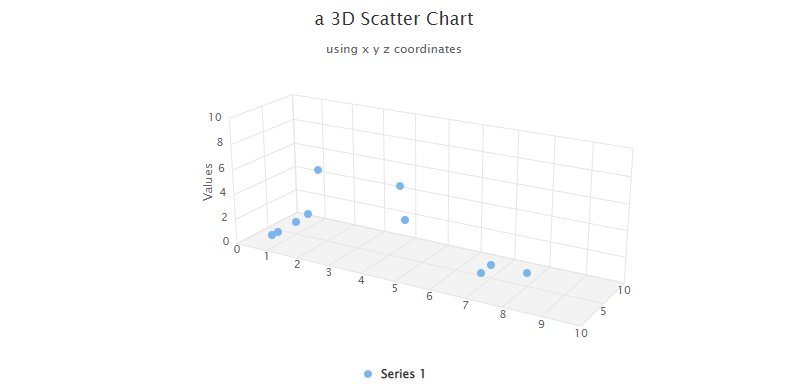
- property scatter_3d: Scatter3DOptions | None
General options to apply to all Scatter 3D series types.
A 3D scatter plot uses x, y and z coordinates to display values for three variables for a set of data.
- Return type:
Scatter3DOptionsorNone
- property series: SeriesOptions | None
General options to apply to all series types.
- Return type:
ScatterOptionsorNone
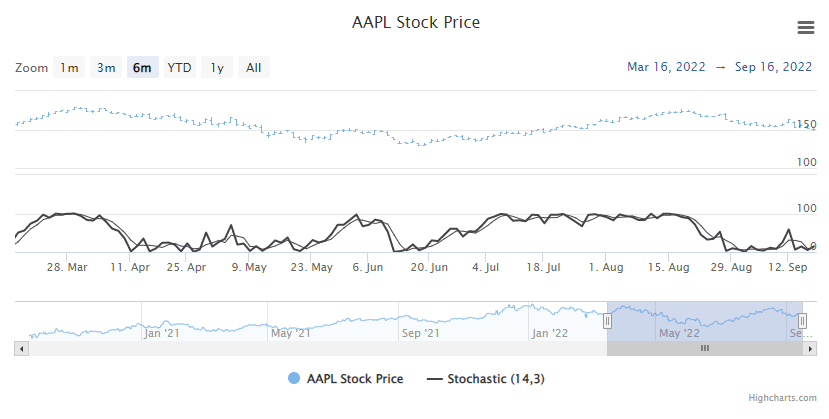
- property slowstochastic: SlowStochasticOptions | None
General configuration for Stochastic Oscillators.
- Return type:
SlowStochasticOptionsorNone
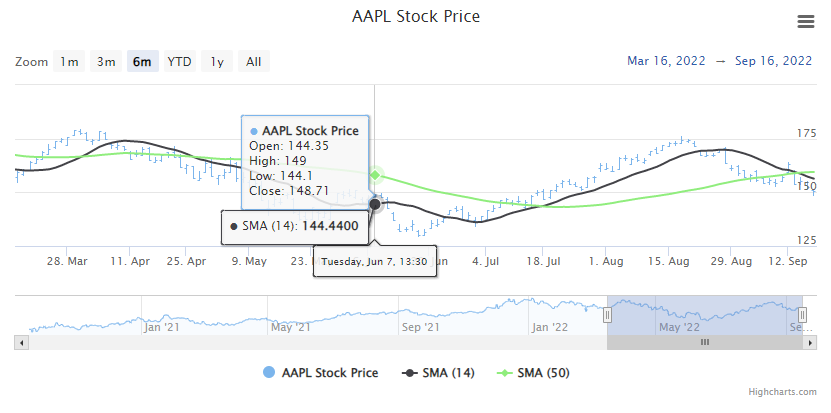
- property sma: SMAOptions | None
General options to configure a Simple Moving Average indicator.
- Return type:
SMAOptionsorNone
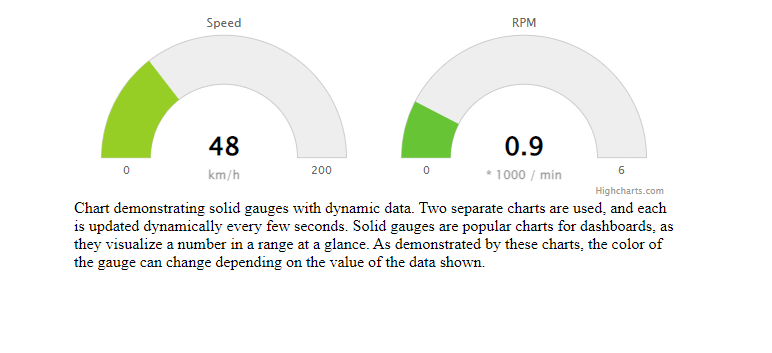
- property solidgauge: SolidGaugeOptions | None
General options to apply to all Solid Gauge series types.
A solid gauge is a circular gauge where the value is indicated by a filled arc, and the color of the arc may variate with the value.
- Return type:
SolidGaugeOptionsorNone
- property spline: SplineOptions | None
General options to apply to all Spline series types.
A spline series is a special type of line series, where the segments between the data points are smoothed.
- Return type:
SplineOptionsorNone
- property stochastic: StochasticOptions | None
General options for Stochastic Oscillators.
- Return type:
StochasticOptionsorNone
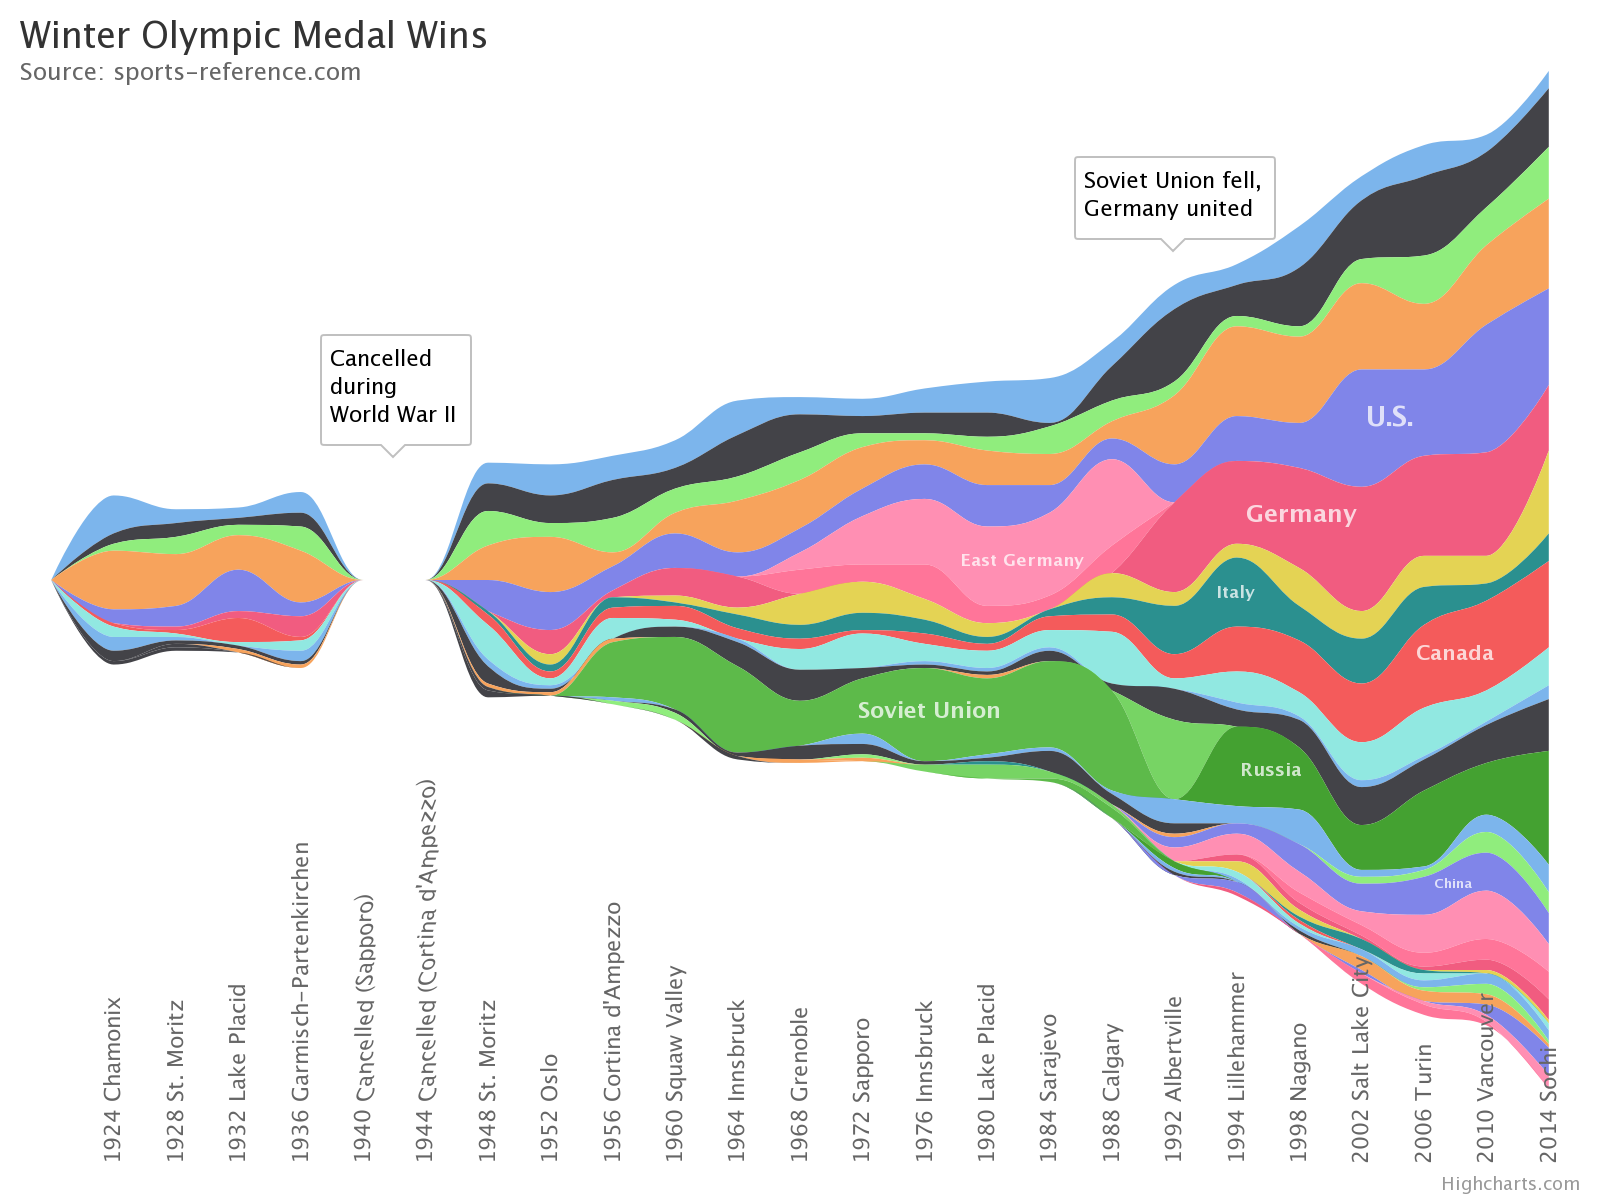
- property streamgraph: StreamGraphOptions | None
General options to apply to all Stream Graph series types.
A streamgraph is a type of stacked area graph which is displaced around a central axis, resulting in a flowing, organic shape.
- Return type:
StreamGraphOptionsorNone
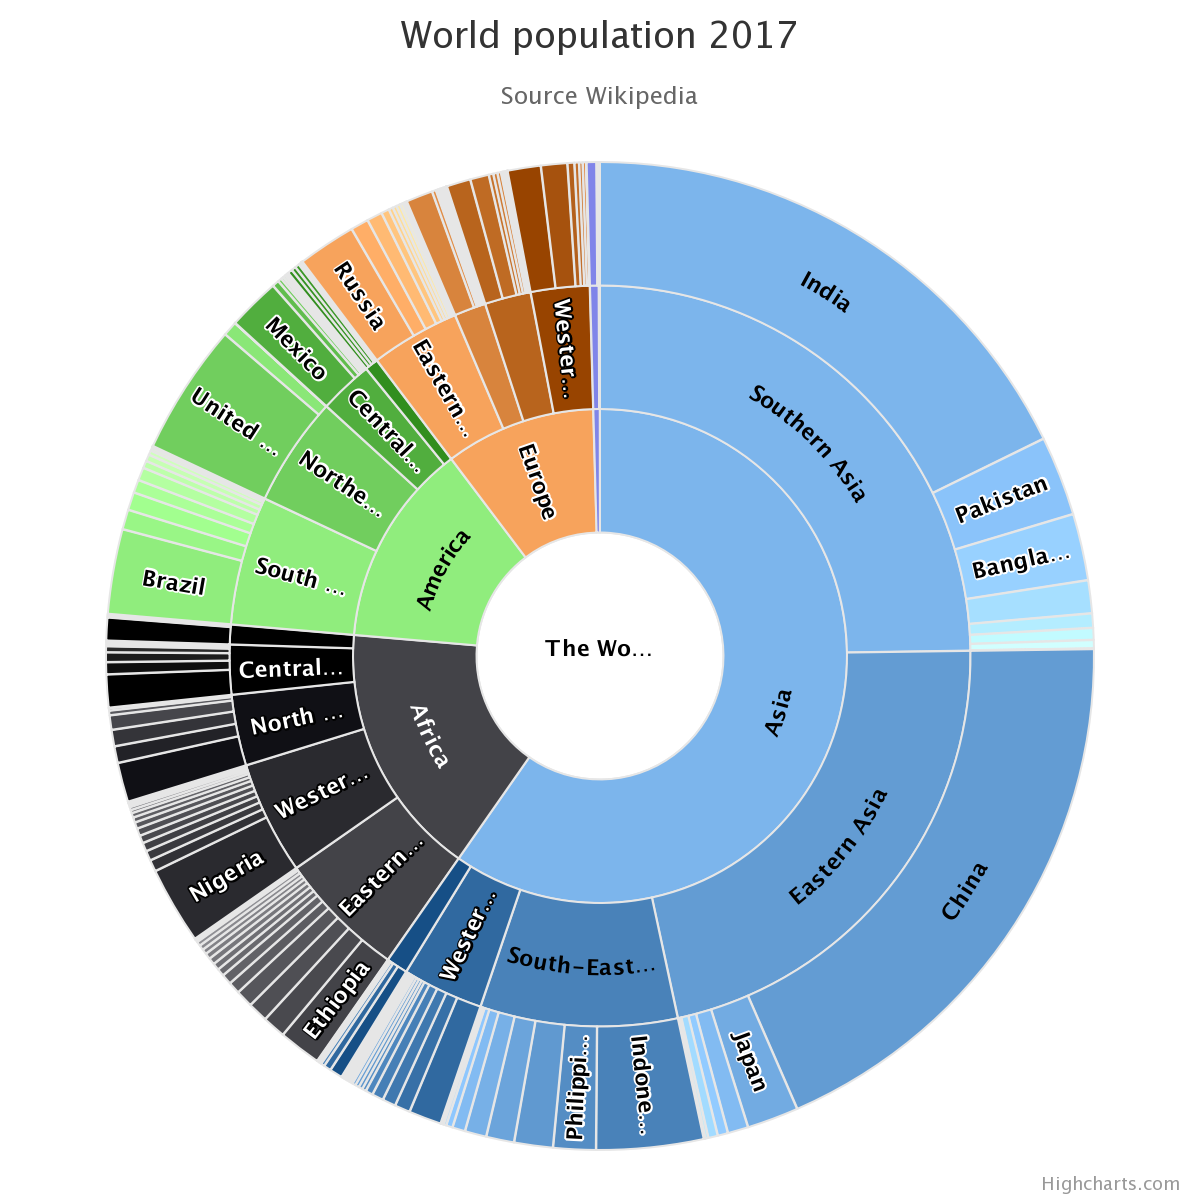
- property sunburst: SunburstOptions | None
General options to apply to all Sunburst series types.
A Sunburst displays hierarchical data, where a level in the hierarchy is represented by a circle. The center represents the root node of the tree. The visualization bears a resemblance to both treemap and pie charts.
- Return type:
SunburstOptionsorNone
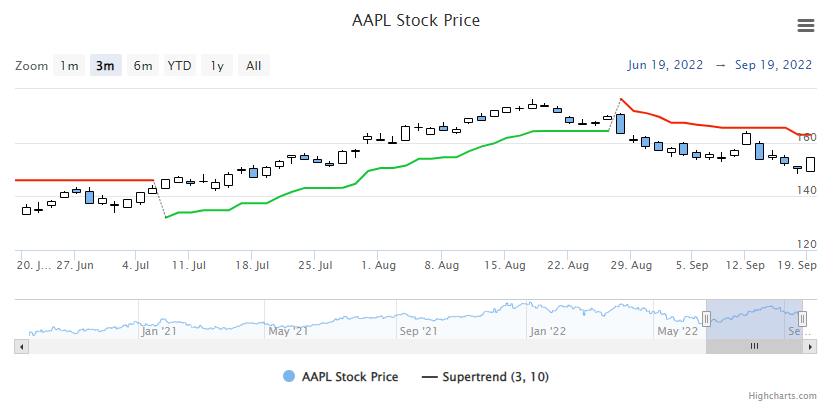
- property supertrend: SupertrendOptions | None
General options to configure a Supertrend, a momentum indicator used to help identify buy/sell signals.
- Return type:
SupertrendOptionsorNone
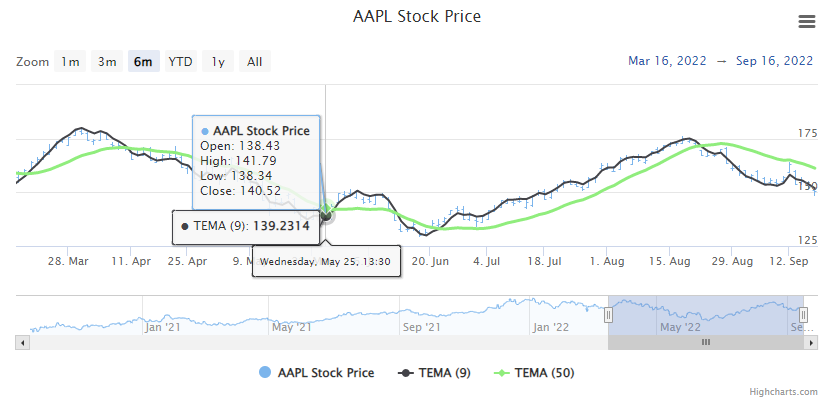
- property tema: TEMAOptions | None
General options to configure a Triple Exponential Moving Average indicator, which is often used to reduce the “noise” produced on a simple moving average.
- Return type:
TEMAOptionsorNone
- property tilemap: TilemapOptions | None
General options to apply to all Tilemap series types.
A tilemap series is a type of heatmap where the tile shapes are configurable.
- Return type:
TilemapOptionsorNone
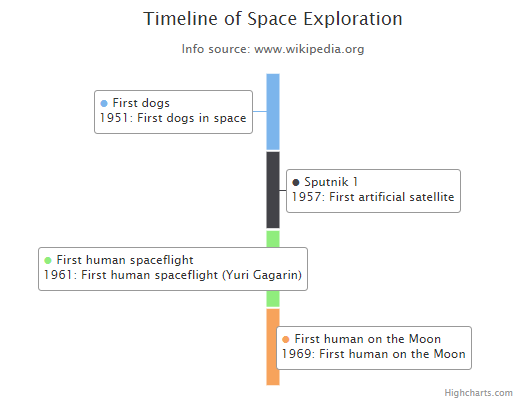
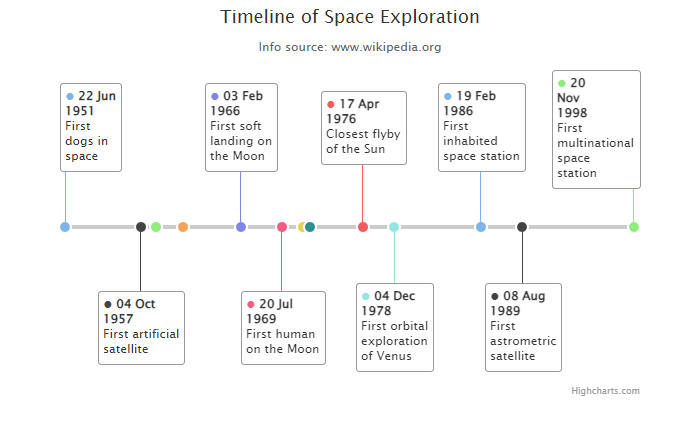
- property timeline: TimelineOptions | None
General options to apply to all Timeline series types.
The timeline series presents given events along a drawn line.
- Return type:
TimelineOptionsorNone
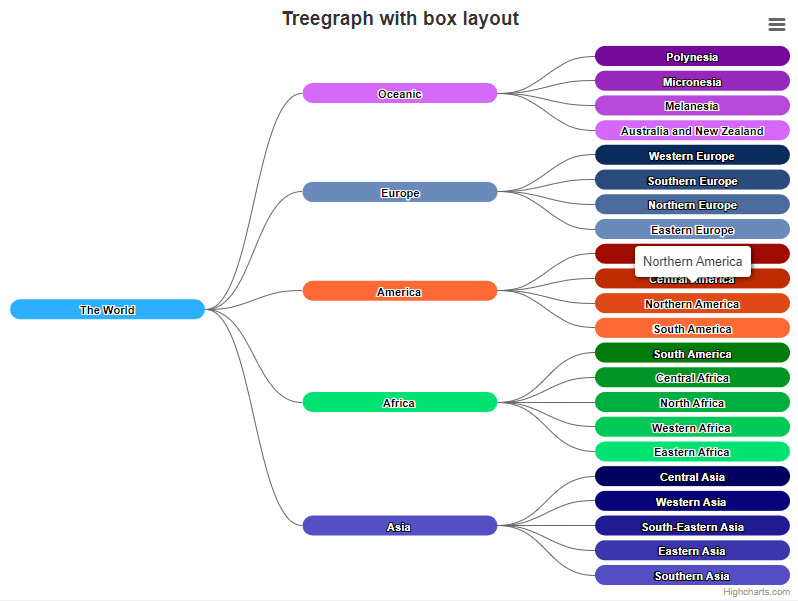
- property treegraph: TreegraphOptions | None
General options to apply to all Treegraph series types.
A treegraph visualizes a relationship between ancestors and descendants with a clear parent-child relationship, e.g. a family tree or a directory structure.
- Return type:
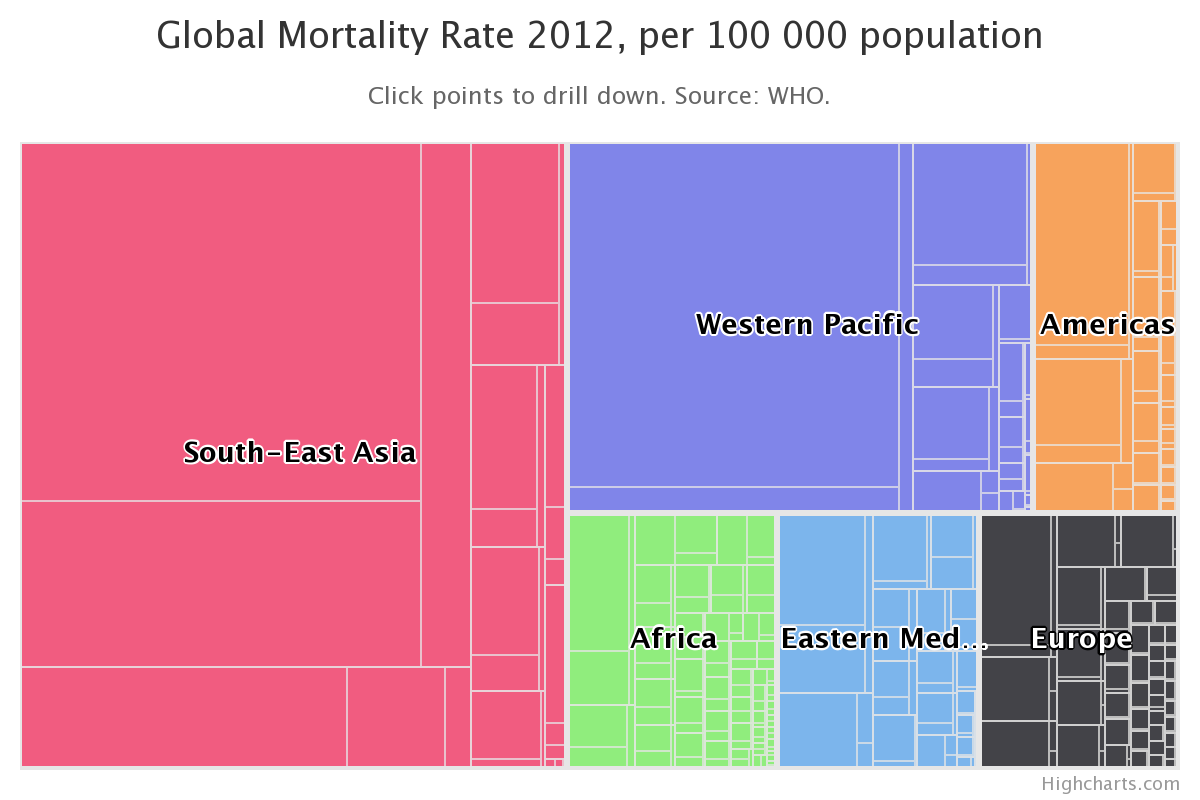
- property treemap: TreemapOptions | None
General options to apply to all Treemap series types.
A treemap displays hierarchical data using nested rectangles. The data can be laid out in varying ways depending on options.
- Return type:
TreemapOptionsorNone
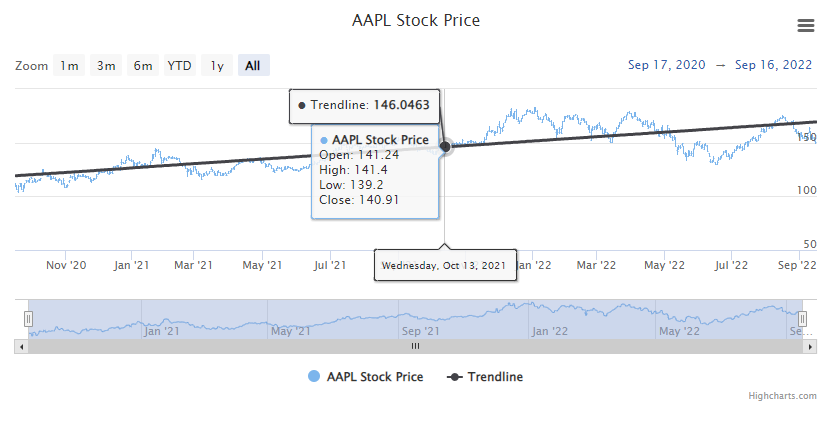
- property trendline: TrendlineOptions | None
General options to configure a Trendline indicator, which fits a straight line to the linked data using the Sum of Least Squares method.
- Return type:
TrendlineOptionsorNone
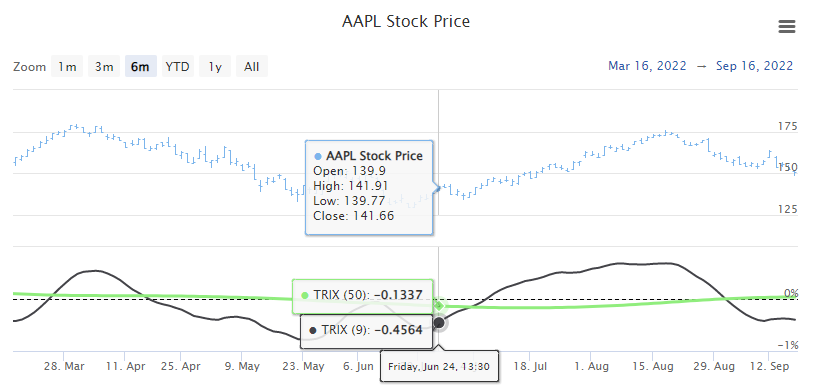
- property trix: TRIXOptions | None
General options to configure a Triple Exponential Average Oscillator, which can be used to suggest increasing or decreasing momentum.
- Return type:
TRIXOptionsorNone
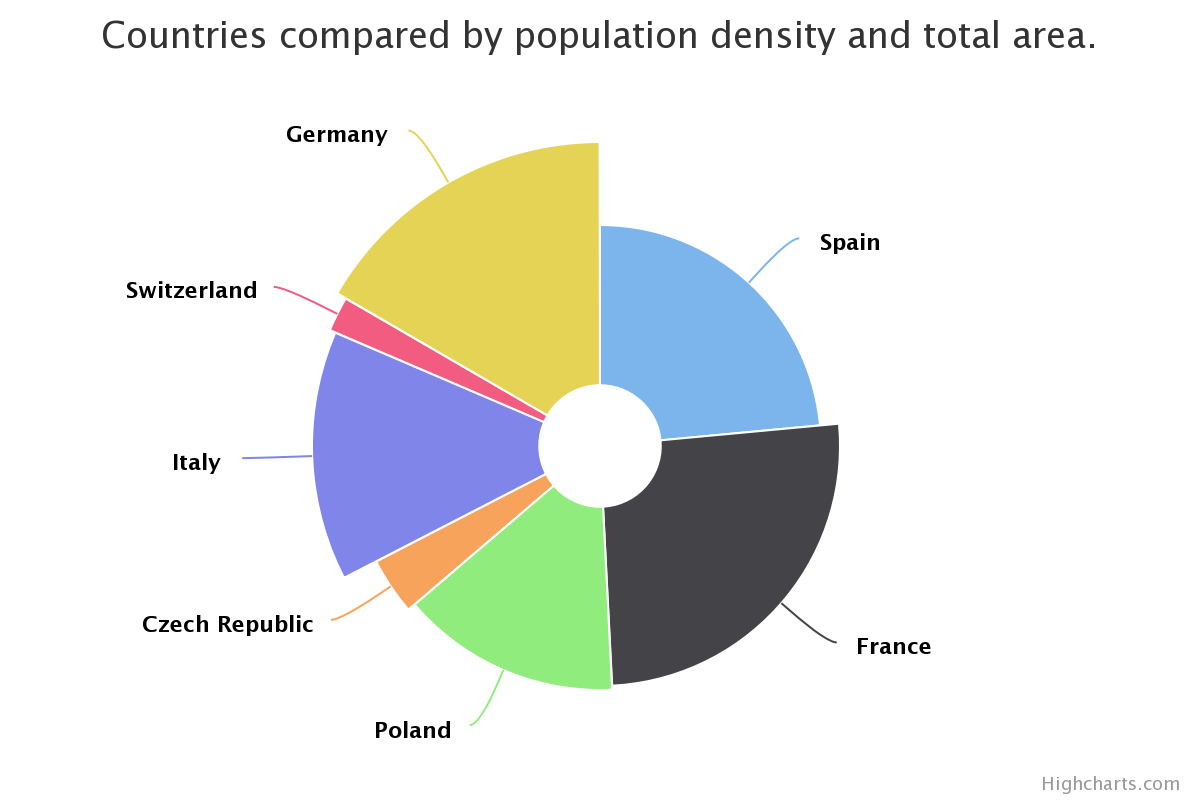
- property variablepie: VariablePieOptions | None
General options to apply to all Variable Pie series types.
A variable pie series is a two dimensional series type, where each point renders an Y and Z value. Each point is drawn as a pie slice where the size (arc) of the slice relates to the Y value and the radius of pie slice relates to the Z value.
- Return type:
VariablePieOptionsorNone
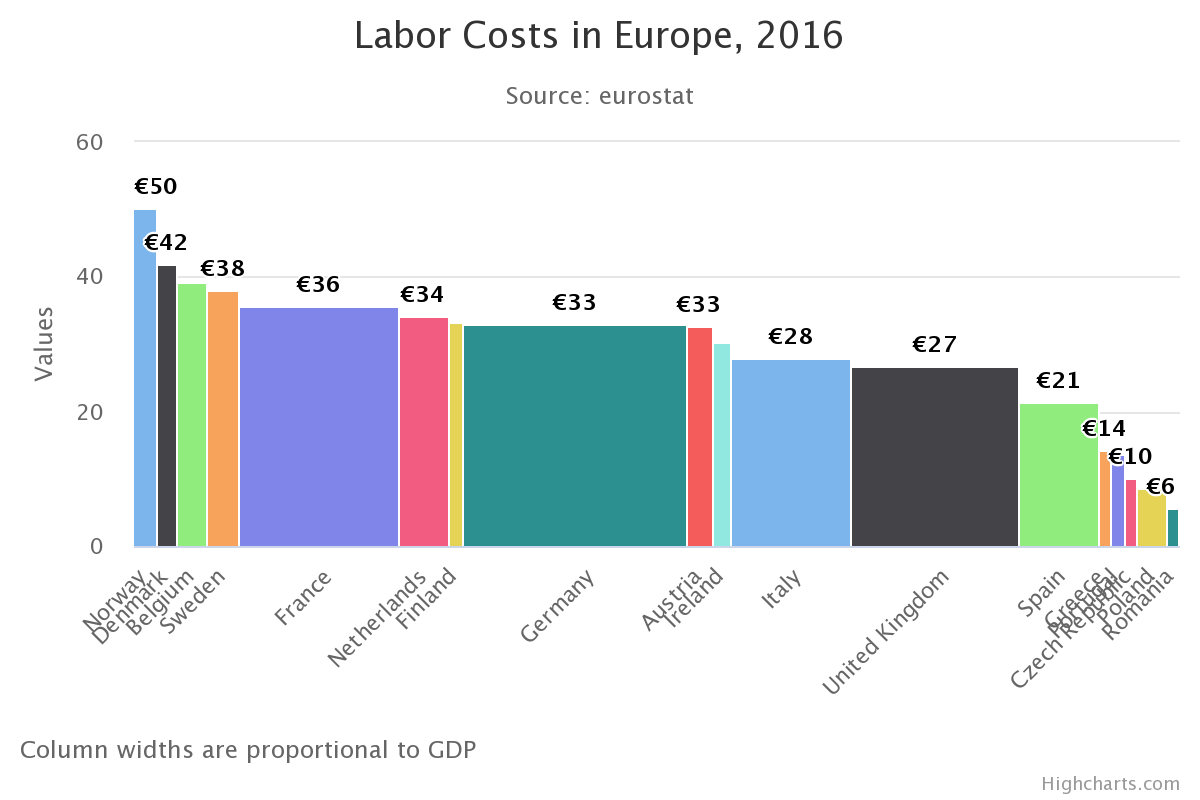
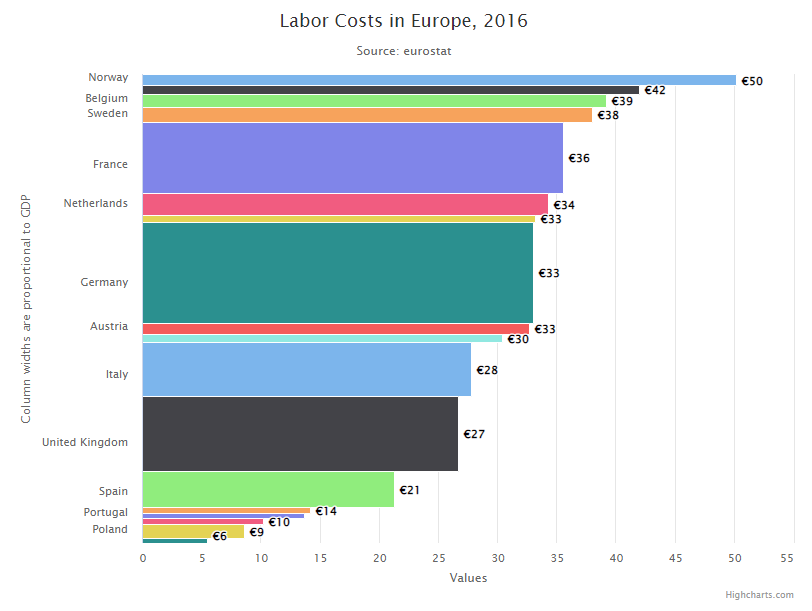
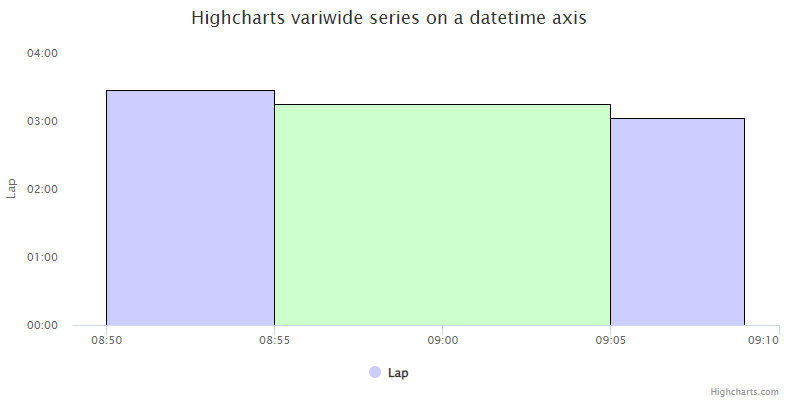
- property variwide: VariwideOptions | None
General options to apply to all Variwide series types.
A variwide chart (related to marimekko chart) is a column chart with a variable width expressing a third dimension.
- Return type:
VariwideOptionsorNone
- property vbp: VBPOptions | None
General options to configure a Volume-by-Price (VBP) indicator, which can be used to analyze volumes traded within various price bands.
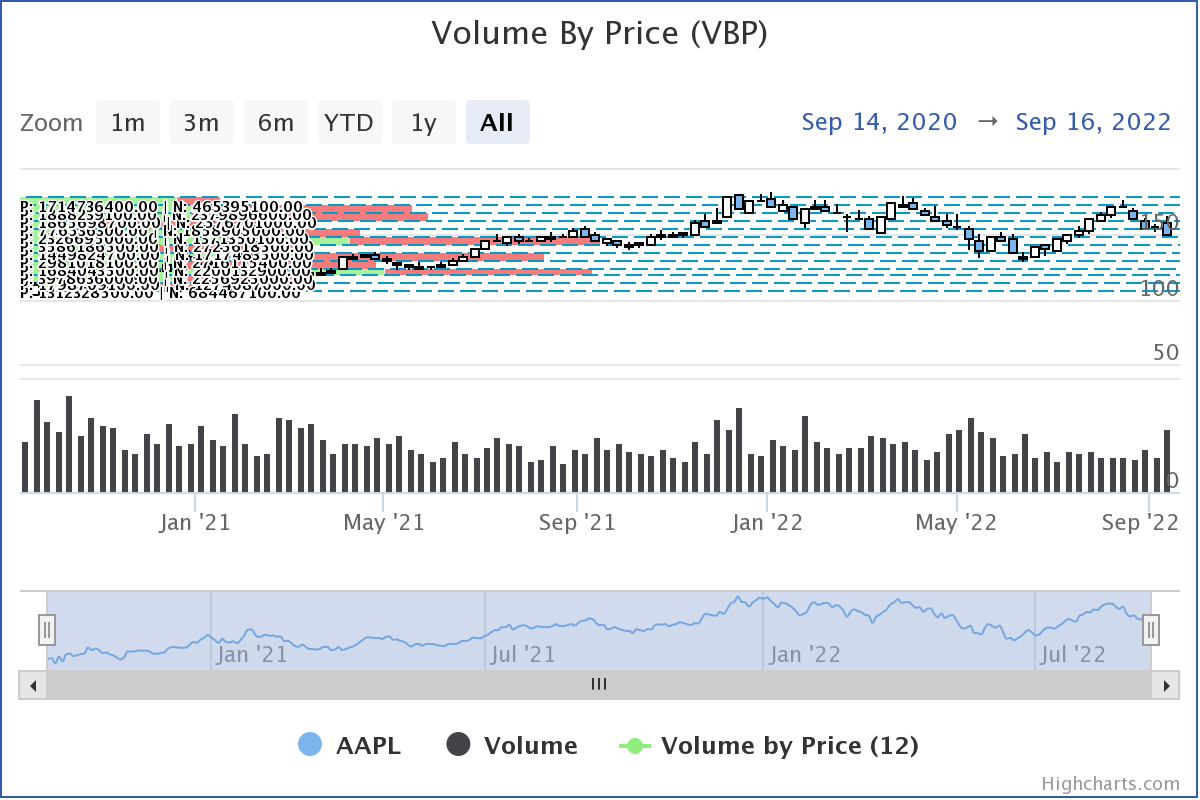
- Return type:
VBPOptionsorNone
- property vector: VectorOptions | None
General options to apply to all Vector series types.
A vector plot is a type of cartesian chart where each point has an X and Y position, a length and a direction. Vectors are drawn as arrows.
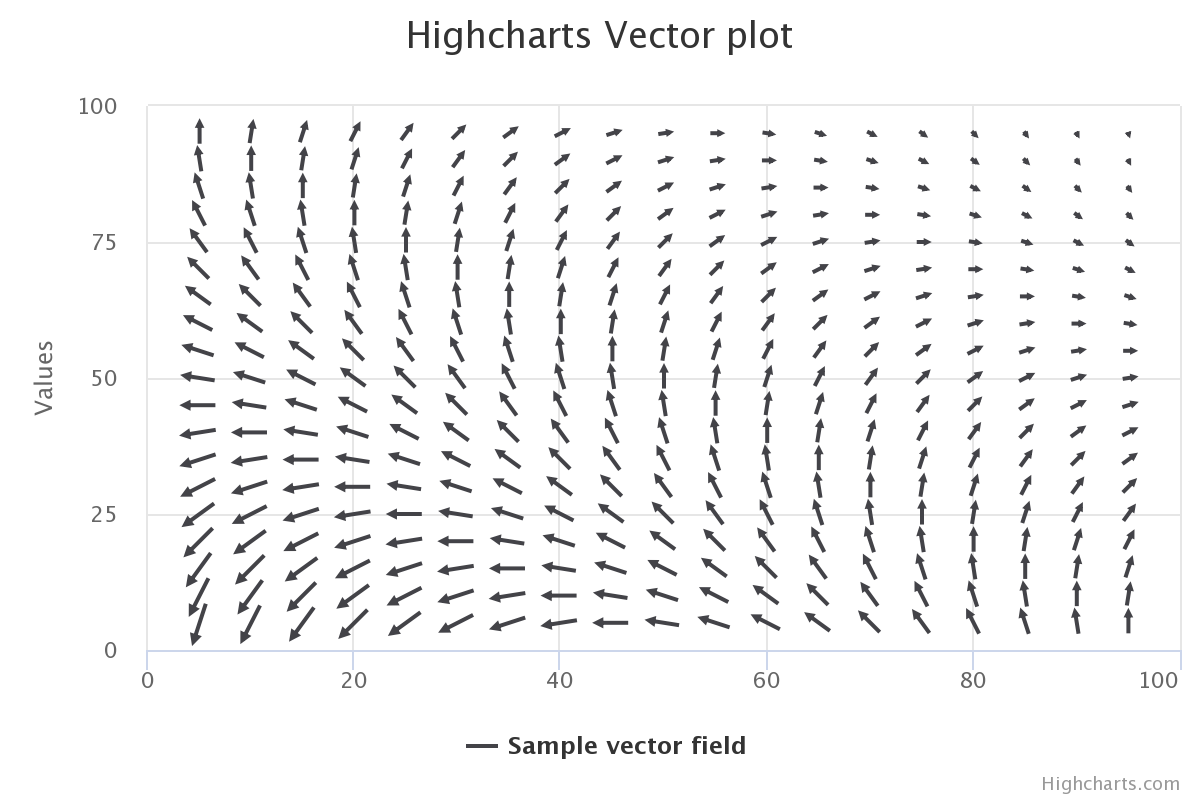
- Return type:
VectorOptionsorNone
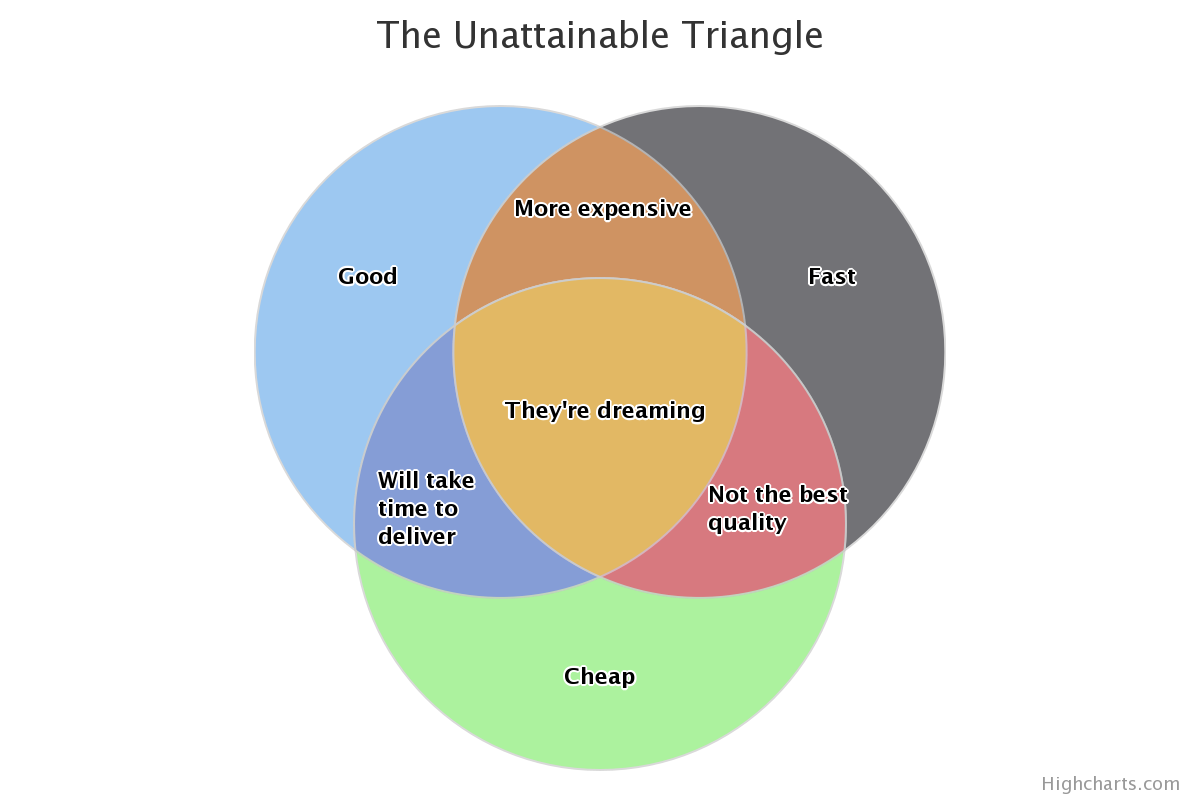
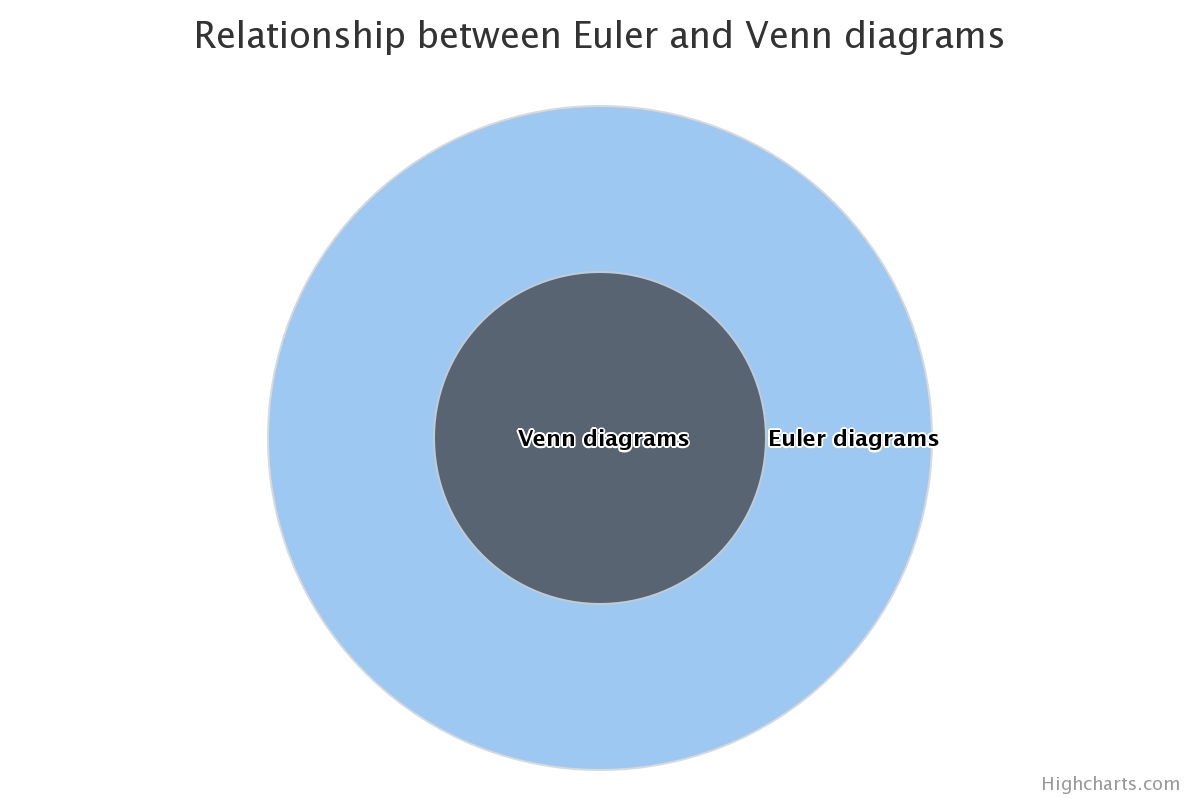
- property venn: VennOptions | None
General options to apply to all Venn series types.
A Venn diagram displays all possible logical relations between a collection of different sets. The sets are represented by circles, and the relation between the sets are displayed by the overlap or lack of overlap between them. The venn diagram is a special case of Euler diagrams, which can also be displayed by this series type.
- Return type:
VennOptionsorNone
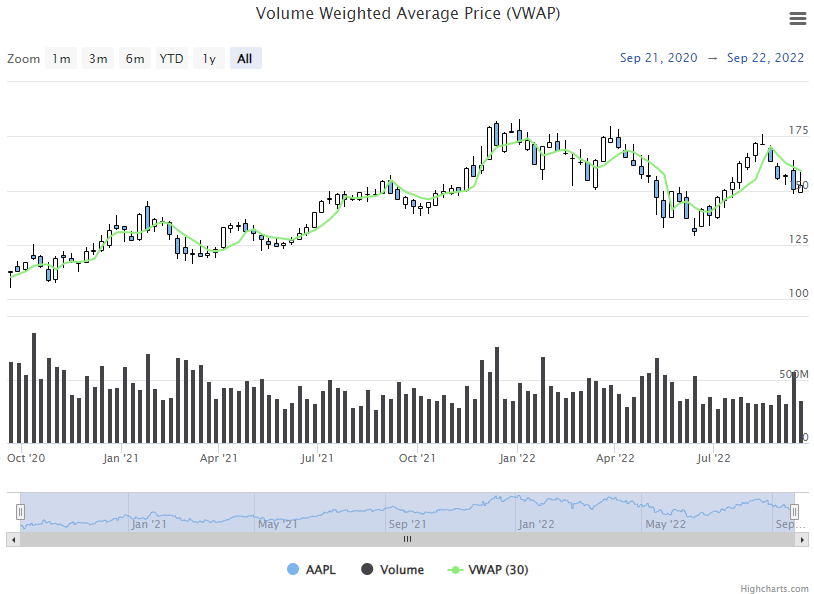
- property vwap: VWAPOptions | None
General options to configure a Volume Weighted Average Price (VWAP) indicator.
- Return type:
VWAPOptionsorNone
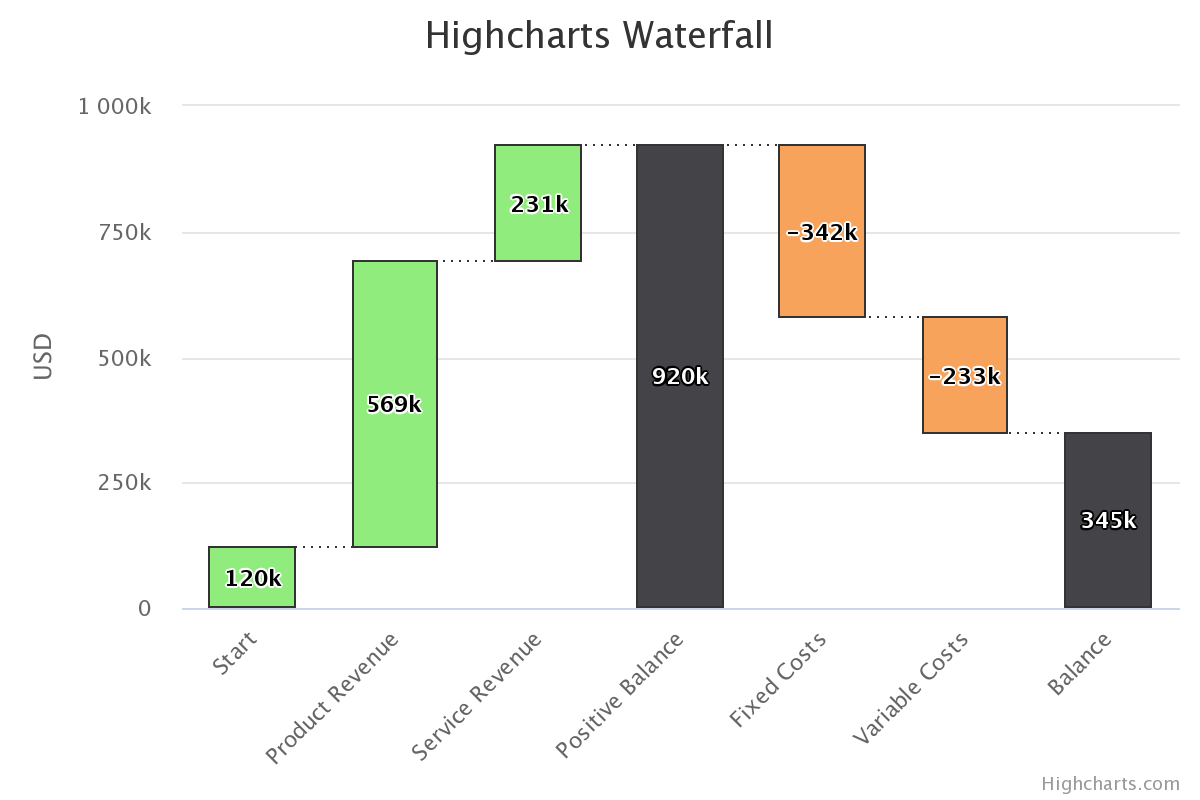
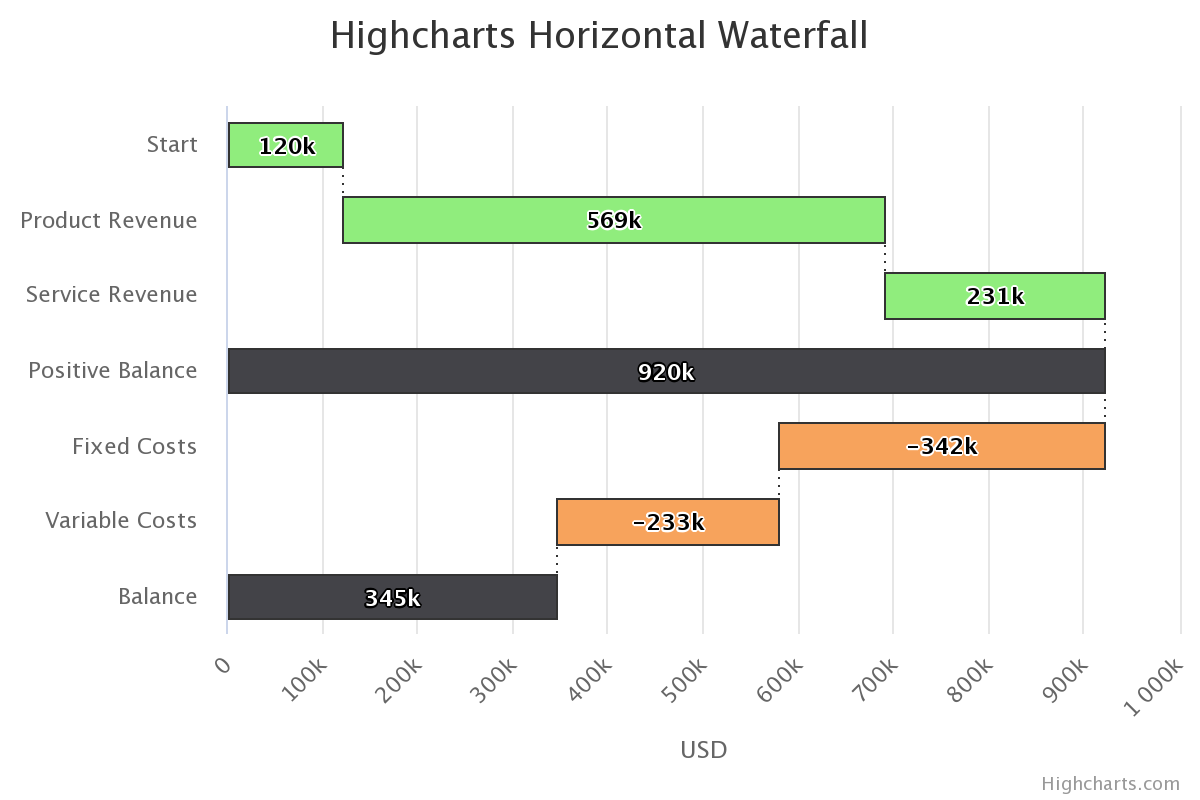
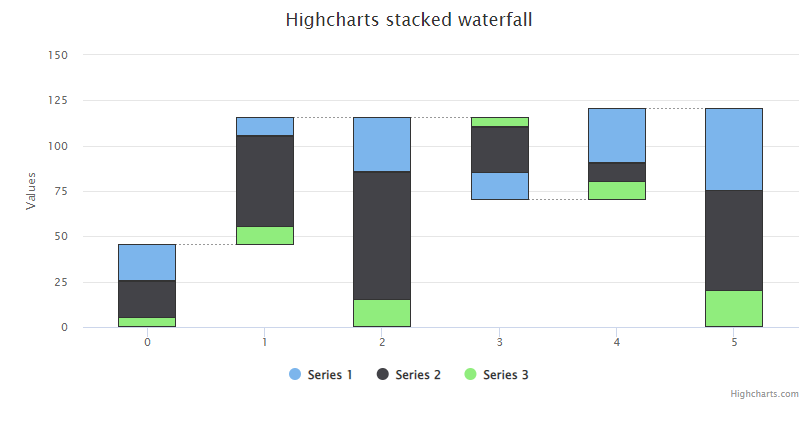
- property waterfall: WaterfallOptions | None
General options to apply to all Waterfall series types.
A waterfall chart displays sequentially introduced positive or negative values in cumulative columns.
- Return type:
WaterfallOptionsorNone
- property williamsr: WilliamsROptions | None
General options to configure a Williams %R oscillator, which uses the current closing price in relation to the high and low of the past
ndays to indicate overbought and oversold levels.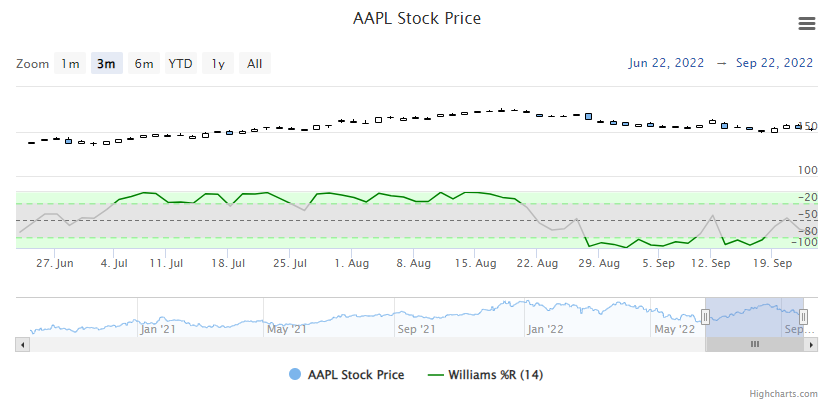
- Return type:
WilliamsROptionsorNone
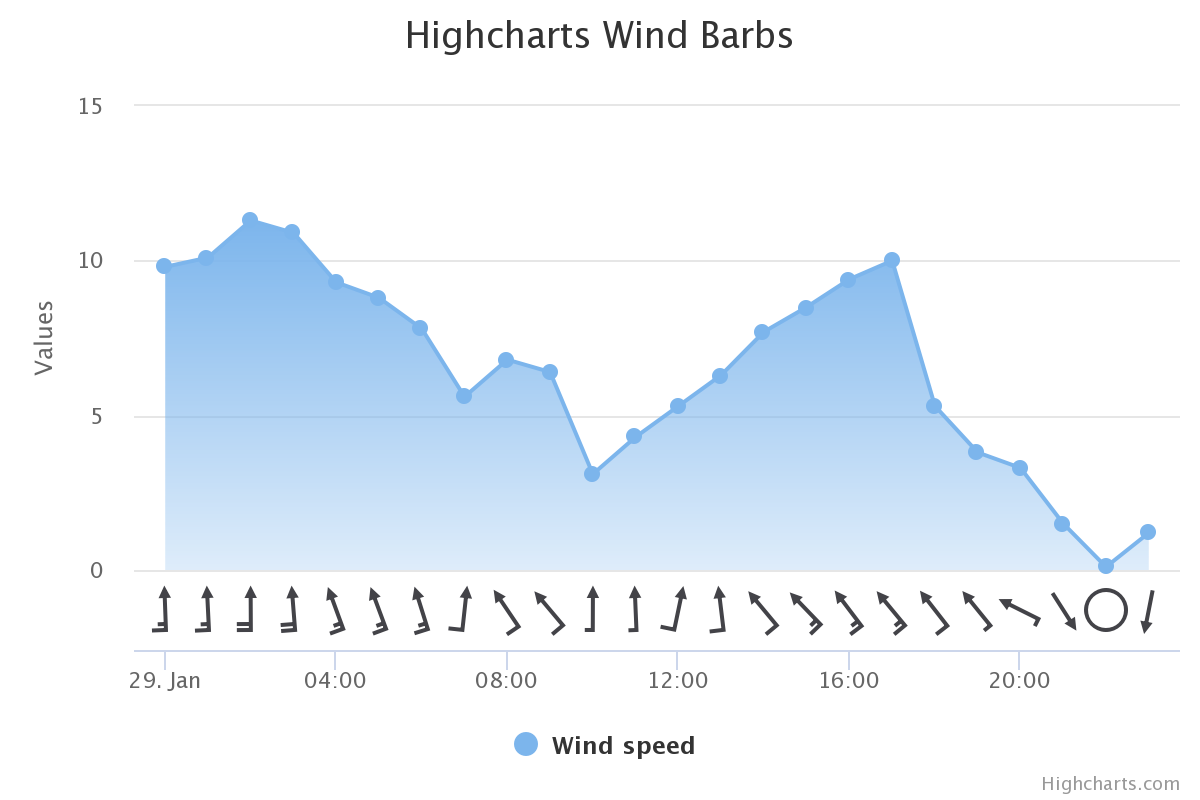
- property windbarb: WindBarbOptions | None
General options to apply to all Wind Barb series types.
Wind barbs are a convenient way to represent wind speed and direction in one graphical form. Wind direction is given by the stem direction, and wind speed by the number and shape of barbs.
- Return type:
WindBarbOptionsorNone
- property wma: WMAOptions | None
General options to configure a Weighted Moving Average indicator.
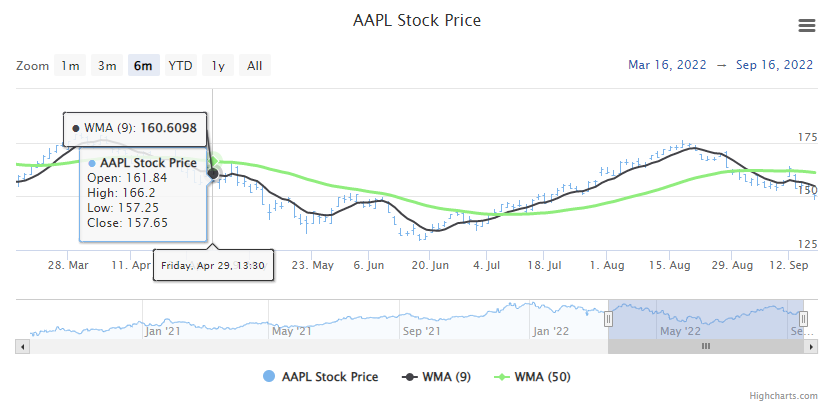
- Return type:
WMAOptionsorNone
- property wordcloud: WordcloudOptions | None
General options to apply to all Wordcloud series types.
A word cloud is a visualization of a set of words, where the size and placement of a word is determined by how it is weighted.
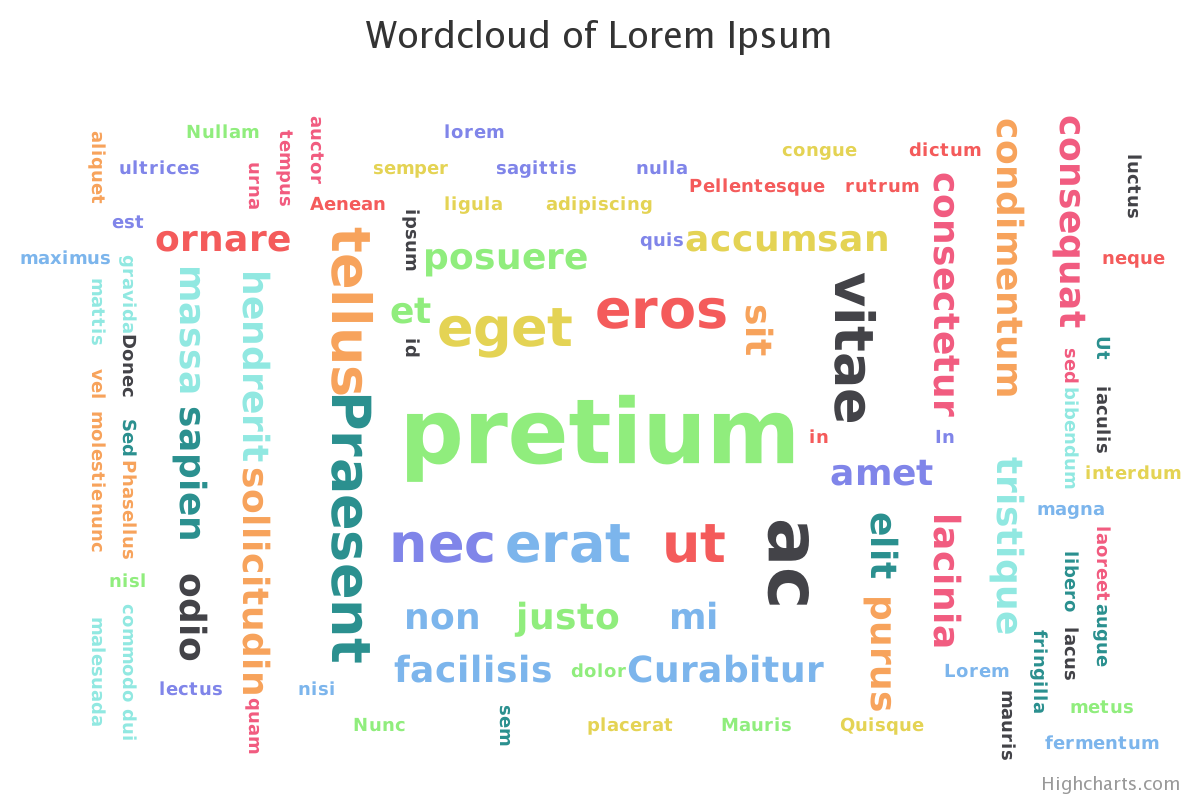
- Return type:
WordcloudOptionsorNone
- property xrange: XRangeOptions | None
General options to apply to all X-Range series types.
The X-range series displays ranges on the X axis, typically time intervals with a start and end date.
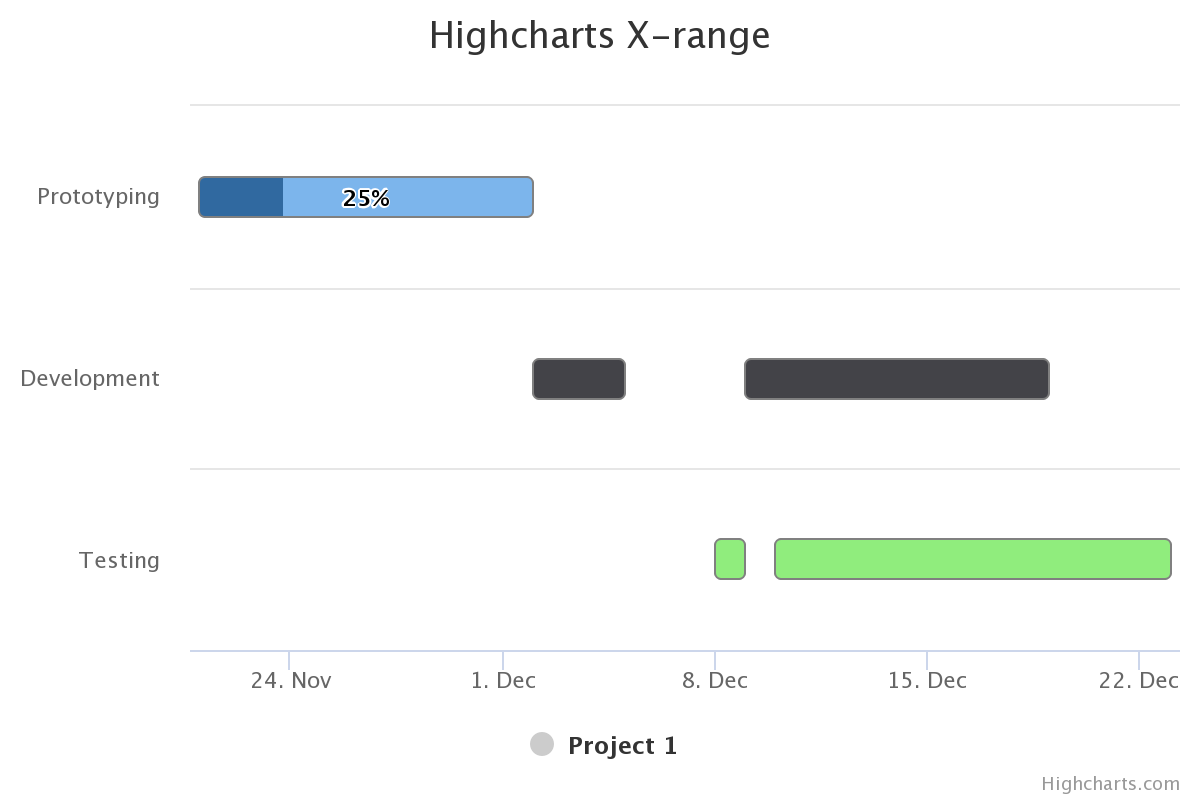
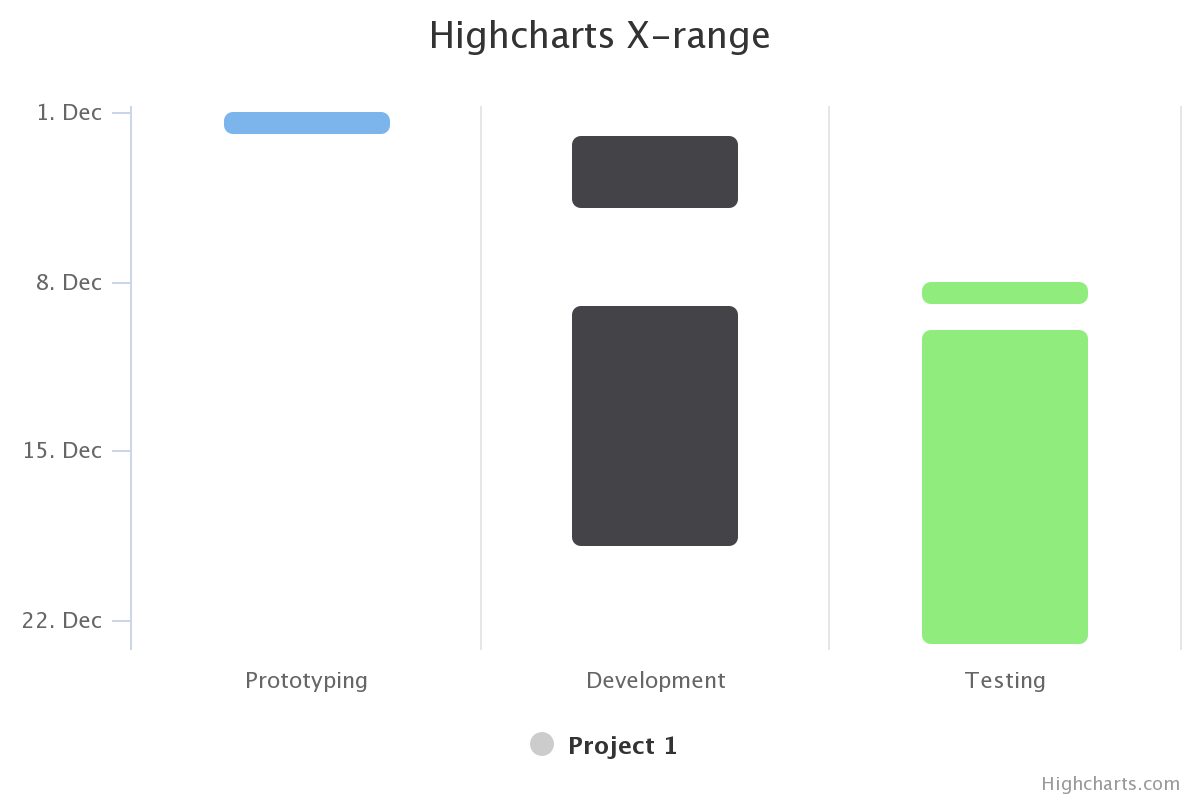
- Return type:
XRangeOptionsorNone
- property zigzag: ZigZagOptions | None
General options to configure a ZigZag indicator.
- Return type:
ZigZagOptionsorNone