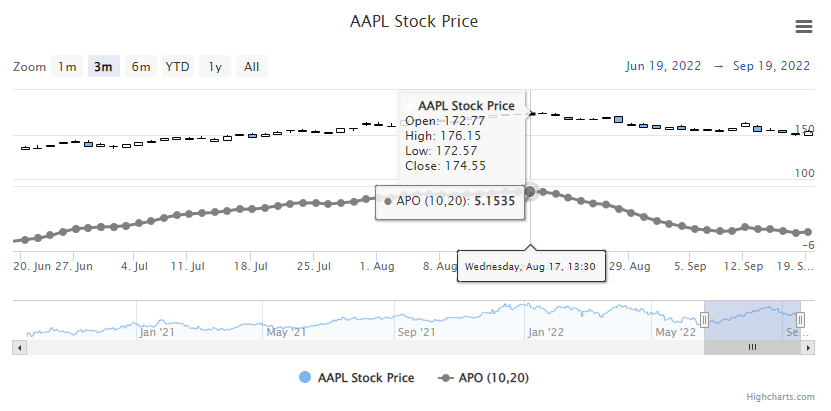
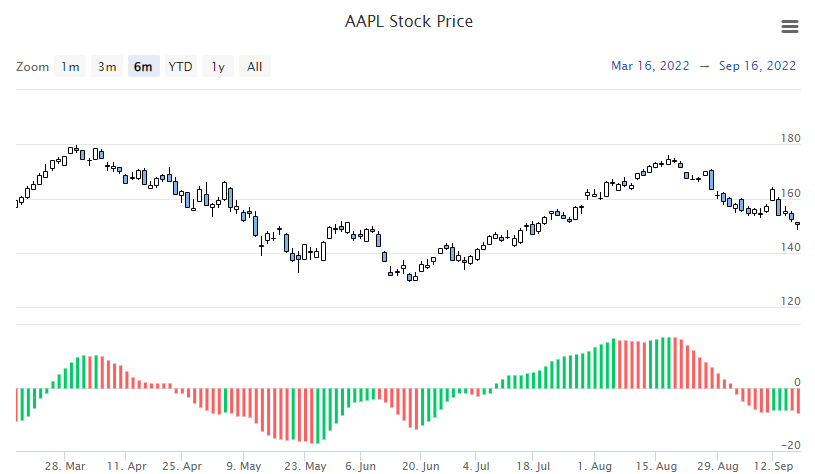
Absolute Price Oscillator
(APO)
highcharts_stock.options.plot_options.oscillators.APOOptions
highcharts_stock.options.series.oscillators.APOSeries
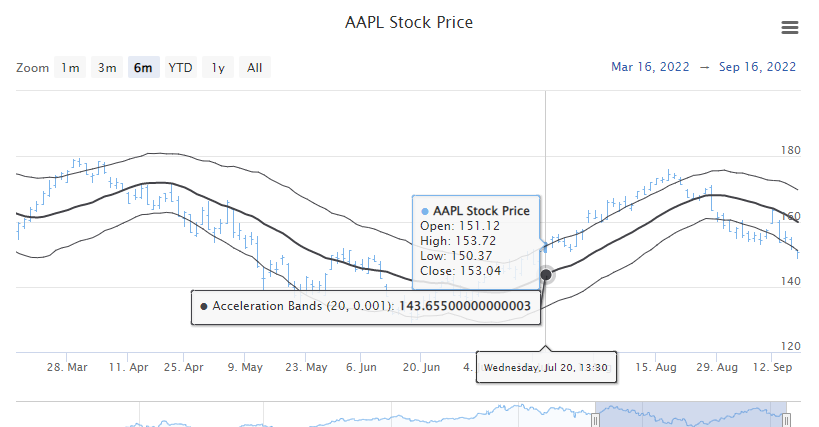
Acceleration Bands
(ABANDS)
highcharts_stock.options.plot_options.abands.AbandsOptions
highcharts_stock.options.series.abands.AbandsSeries
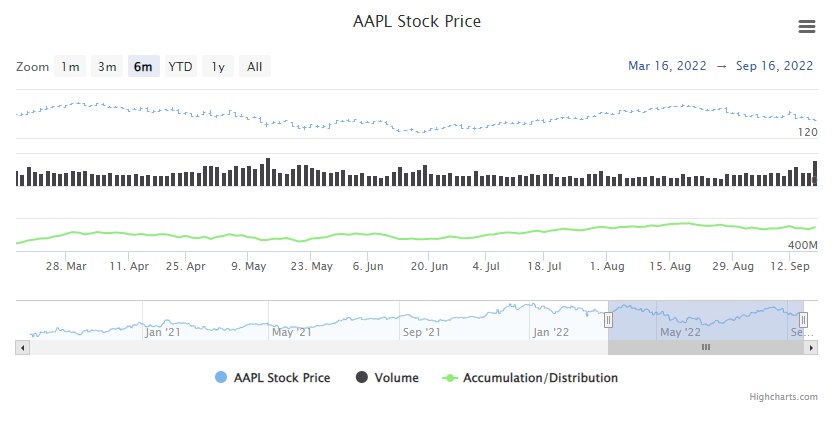
Accumulation/Distribution
highcharts_stock.options.plot_options.ad.ADOptions
highcharts_stock.options.series.ad.ADSeries
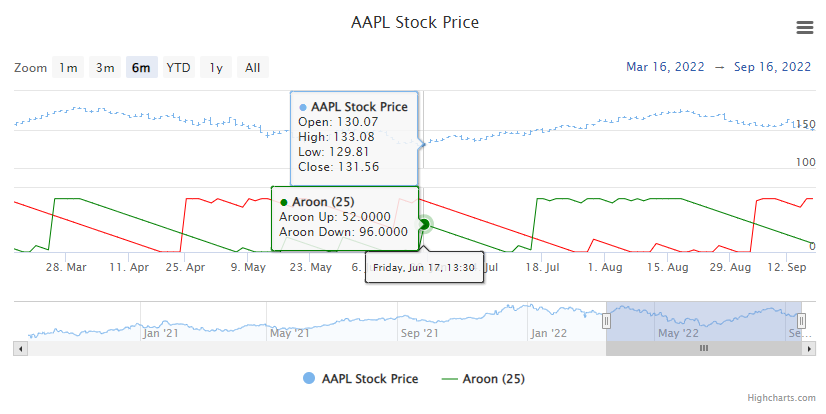
Aroon
highcharts_stock.options.plot_options.aroon.AroonOptions
highcharts_stock.options.series.aroon.AroonSeries
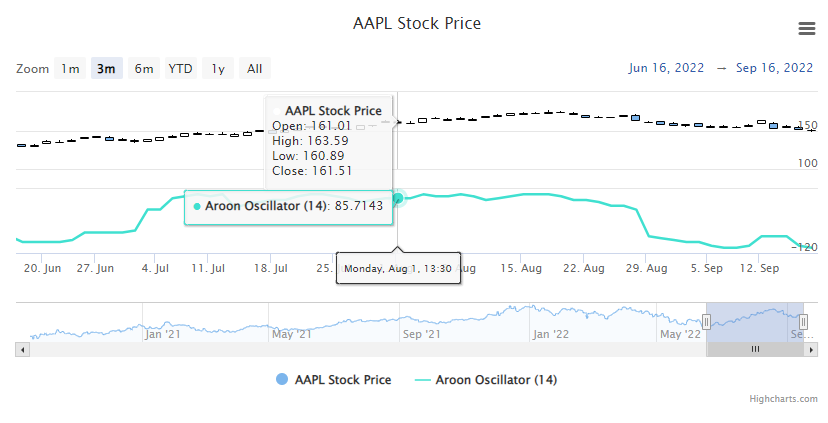
Aroon Oscillator
highcharts_stock.options.plot_options.oscillators.AroonOscillatorOptions
highcharts_stock.options.series.oscillators.AroonOscillatorSeries
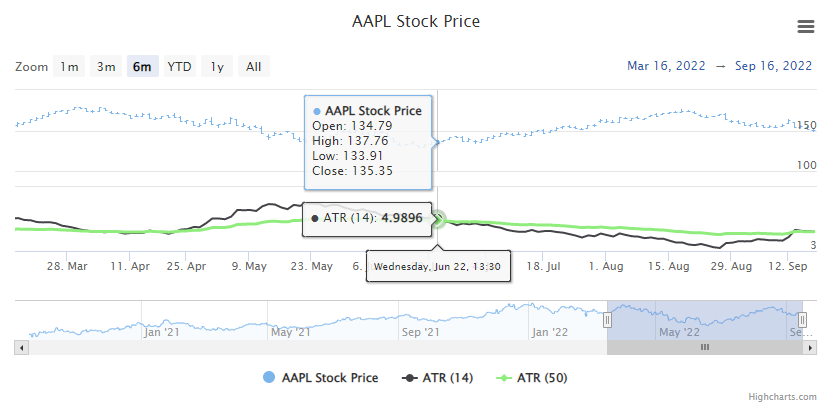
Average True Range
(ATR)
highcharts_stock.options.plot_options.atr.ATROptions
highcharts_stock.options.series.atr.ATRSeries
Awesome Oscillator
(AO)
highcharts_stock.options.plot_options.oscillators.ao.AOOptions
highcharts_stock.options.series.oscillators.ao.AOSeries
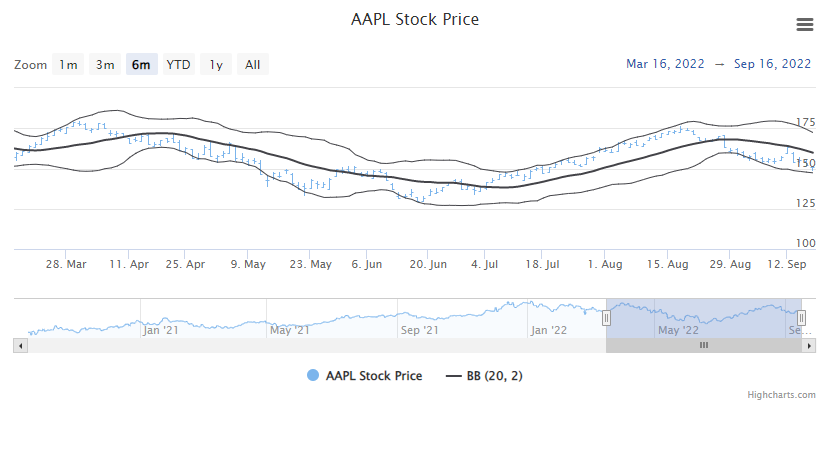
Bollinger Bands
(BB)
highcharts_stock.options.plot_options.abands.BBOptions
highcharts_stock.options.series.abands.BBSeries
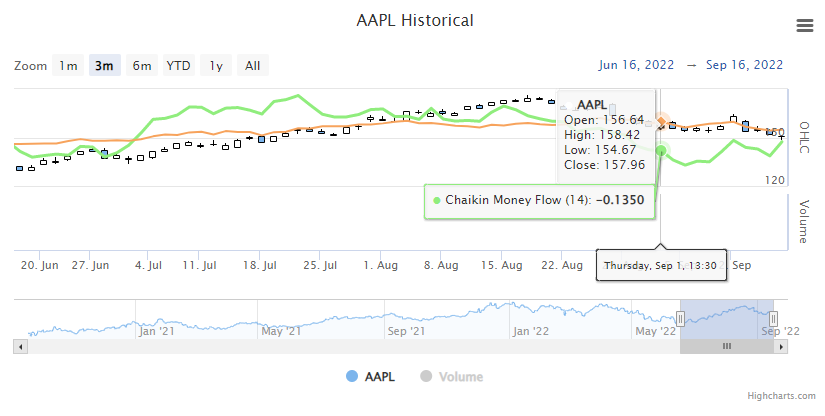
Chaikin Money Flow
(CMF)
highcharts_stock.options.plot_options.oscillators.money_flow.CMFOptions
highcharts_stock.options.series.oscillators.money_flow.CMFSeries
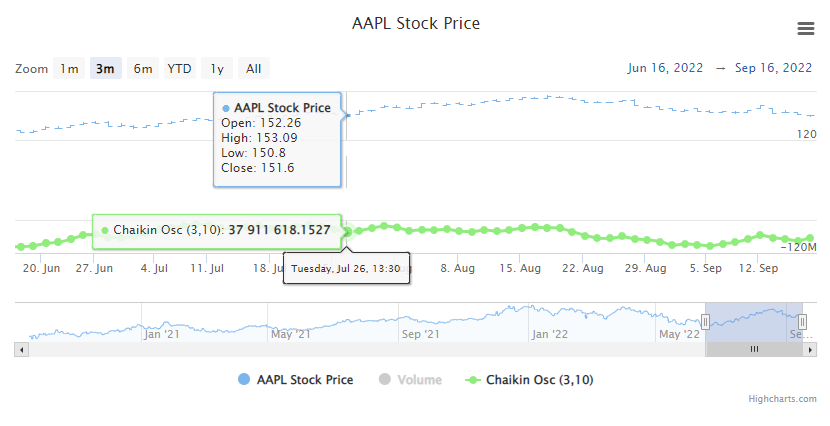
Chaikin Oscillator
highcharts_stock.options.plot_options.oscillators.ChaikinOptions
highcharts_stock.options.series.oscillators.ChaikinSeries
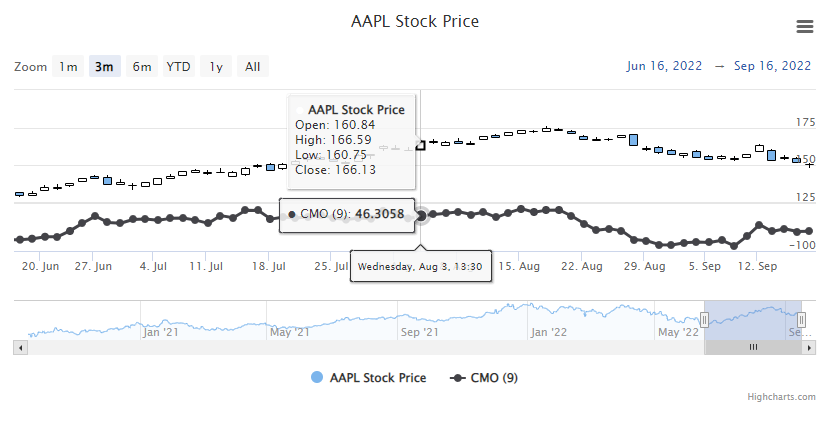
Chande Momentum Oscillator
(CMO)
highcharts_stock.options.plot_options.oscillators.CMOOptions
highcharts_stock.options.series.oscillators.CMOSeries
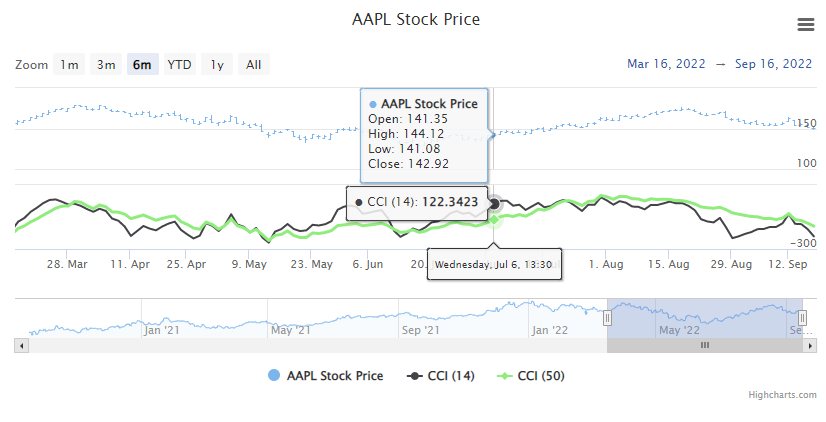
Commodity Channel Index
(CCI)
highcharts_stock.options.plot_options.oscillators.CCIOptions
highcharts_stock.options.series.oscillators.CCISeries
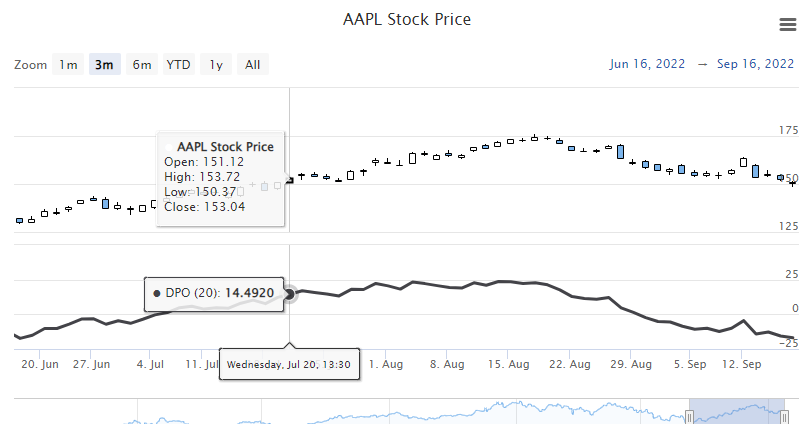
Detrended Price Oscillator
(DPO)
highcharts_stock.options.plot_options.oscillators.DPOOptions
highcharts_stock.options.series.oscillators.DPOSeries
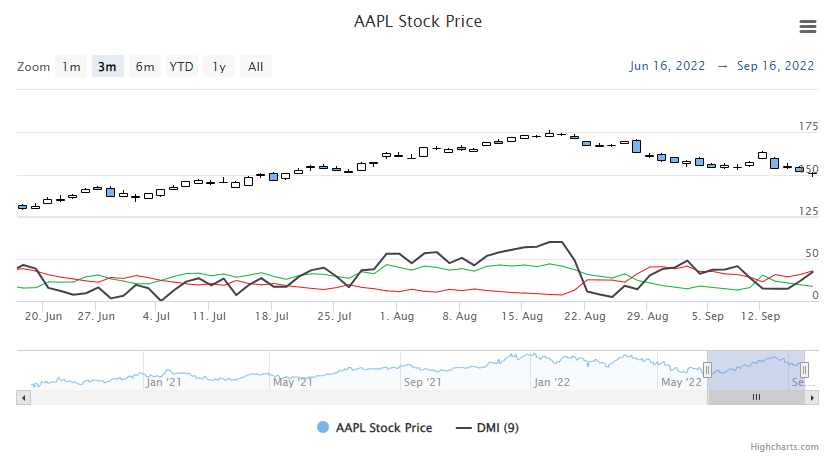
Directional Movement Index
(DMI)
highcharts_stock.options.plot_options.dmi.DMIOptions
highcharts_stock.options.series.dmi.DMISeries
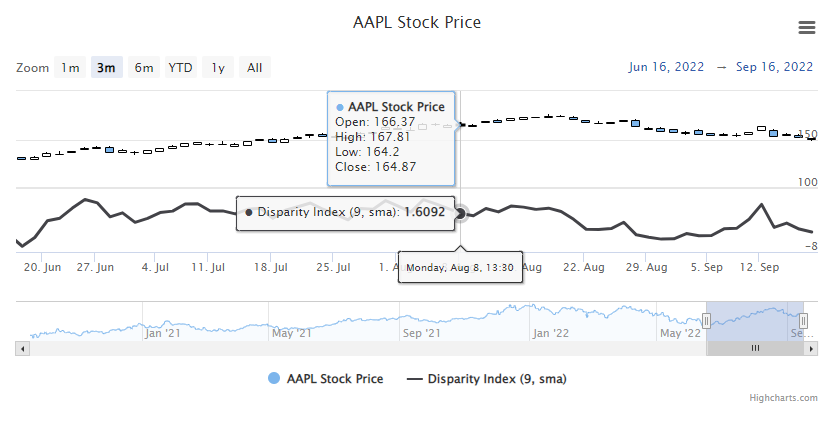
Disparity Index
highcharts_stock.options.plot_options.disparity_index.DisparityIndexOptions
highcharts_stock.options.series.disparity_index.DisparityIndexSeries
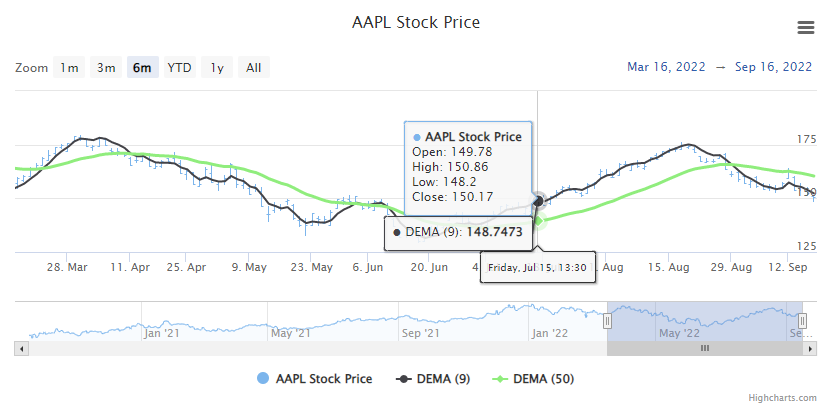
Double Exponential
Moving Average
(DEMA)
highcharts_stock.options.plot_options.averages.DEMAOptions
highcharts_stock.options.series.averages.DEMASeries
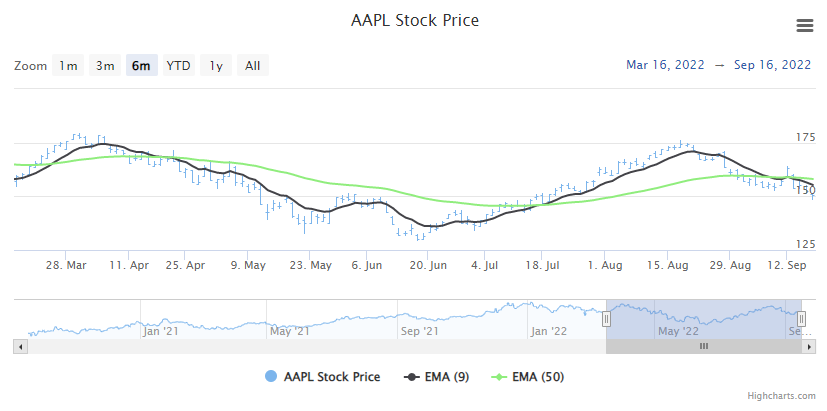
Exponential Moving
Average
(EMA)
highcharts_stock.options.plot_options.averages.EMAOptions
highcharts_stock.options.series.averages.EMASeries
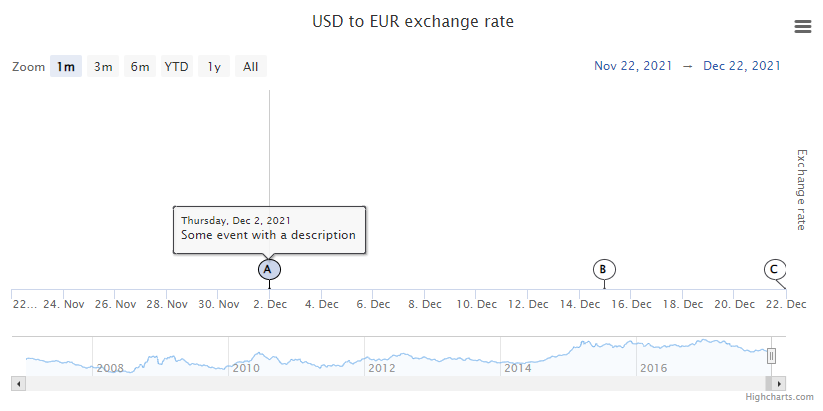
Flags
highcharts_stock.options.plot_options.flags.FlagsOptions
highcharts_stock.options.series.flags.FlagsSeries
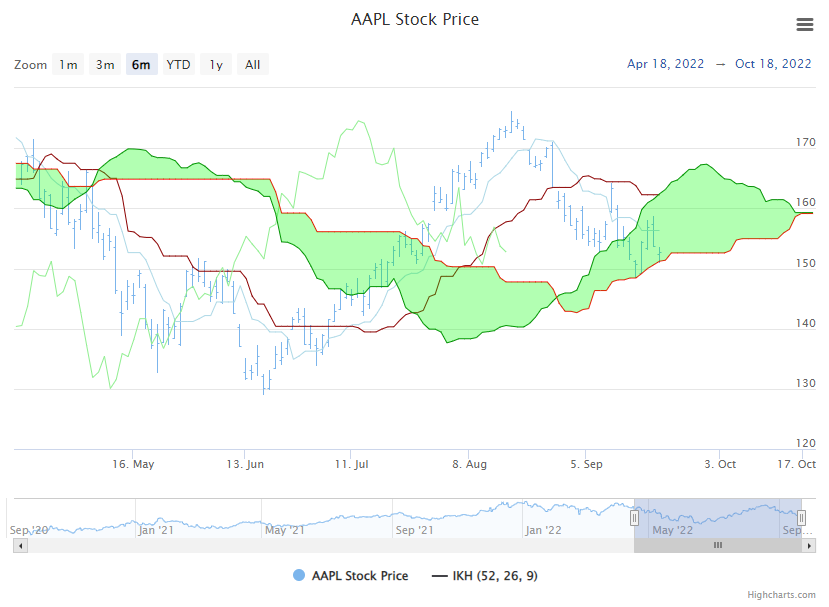
Ichimoku Kinko Hyo
(IKH)
highcharts_stock.options.plot_options.momentum.ikh.IKHOptions
highcharts_stock.options.series.momentum.ikh.IKHSeries
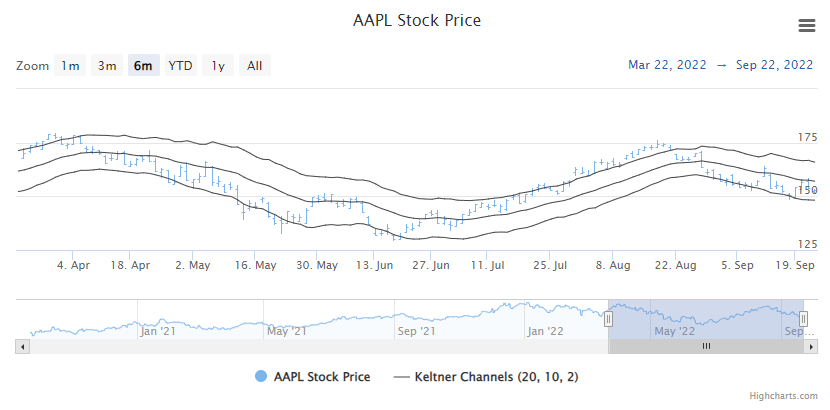
Keltner Channels
highcharts_stock.options.plot_options.abands.KeltnerChannelsOptions
highcharts_stock.options.series.abands.KeltnerChannelsSeries
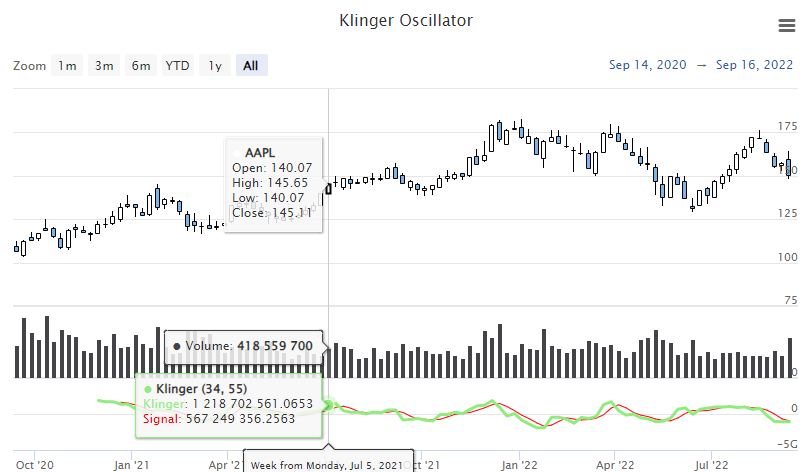
Klinger Oscillator
highcharts_stock.options.plot_options.oscillators.klinger.KlingerOptions
highcharts_stock.options.series.oscillators.klinger.KlingerSeries
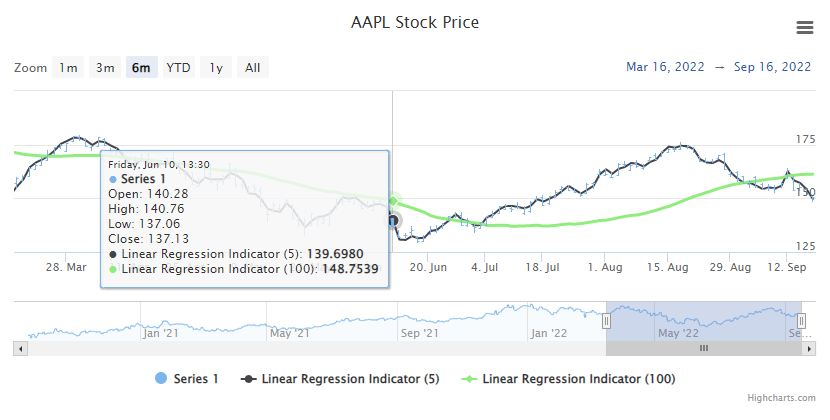
Linear Regression
highcharts_stock.options.plot_options.linear_regressions.LinearRegressionOptions
highcharts_stock.options.series.linear_regressions.LinearRegressionSeries
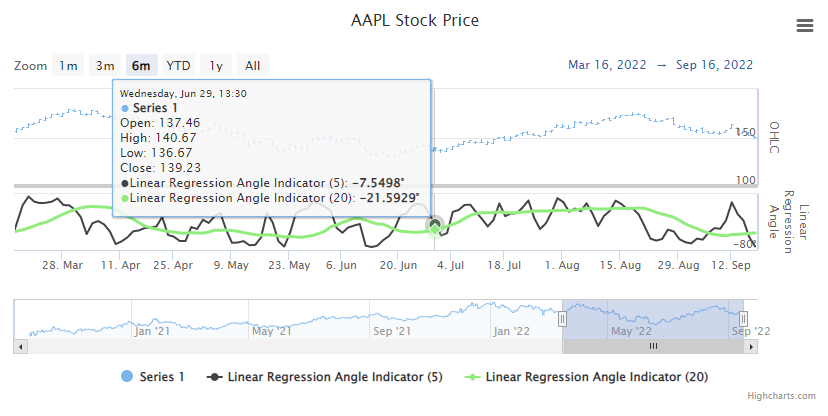
Linear Regression
Angle
highcharts_stock.options.plot_options.linear_regressions.LinearRegressionAngleOptions
highcharts_stock.options.series.linear_regressions.LinearRegressionAngleSeries
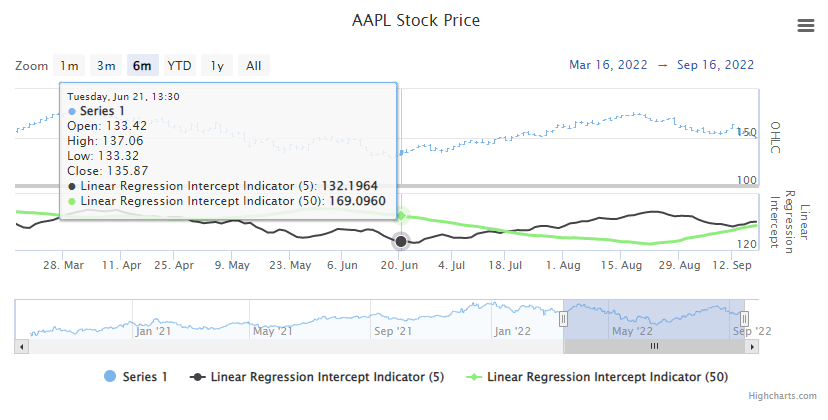
Linear Regression
Intercept
highcharts_stock.options.plot_options.linear_regressions.LinearRegressionInterceptOptions
highcharts_stock.options.series.linear_regressions.LinearRegressionInterceptSeries
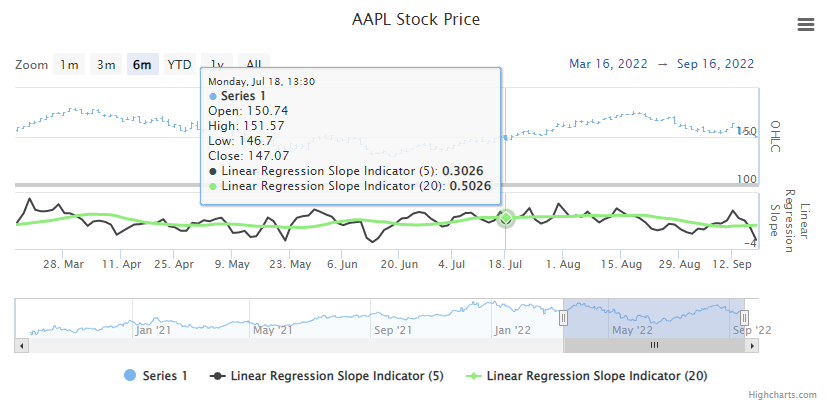
Linear Regression
Slope
highcharts_stock.options.plot_options.linear_regressions.LinearRegressionSlopeOptions
highcharts_stock.options.series.linear_regressions.LinearRegressionSlopeSeries
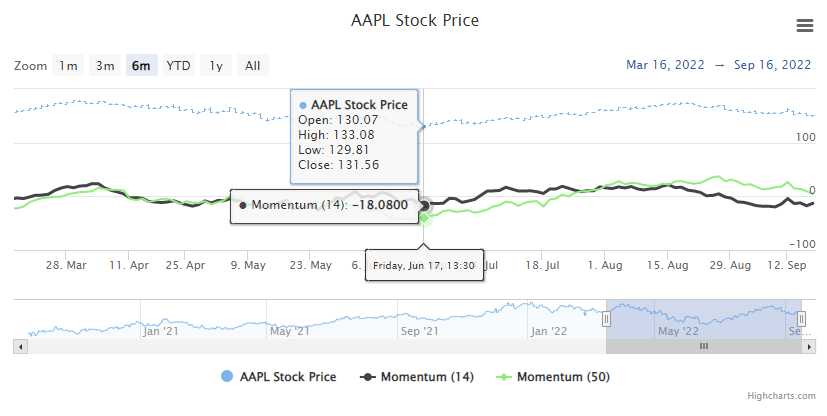
Momentum
highcharts_stock.options.plot_options.momentum.MomentumOptions
highcharts_stock.options.series.momentum.MomentumSeries
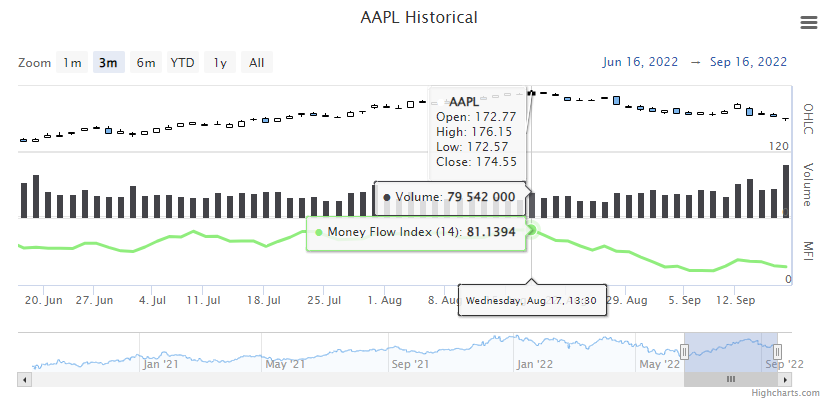
Money Flow Index
(MFI)
highcharts_stock.options.plot_options.oscillators.mfi.MFIOptions
highcharts_stock.options.series.oscillators.mfi.MFISeries
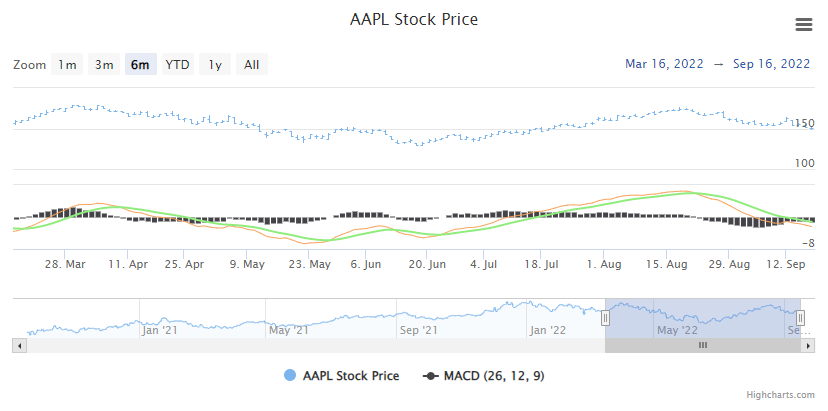
Moving Average
Convergence/Divergence
(MACD)
highcharts_stock.options.plot_options.momentum.macd.MACDOptions
highcharts_stock.options.series.momentum.macd.MACDSeries
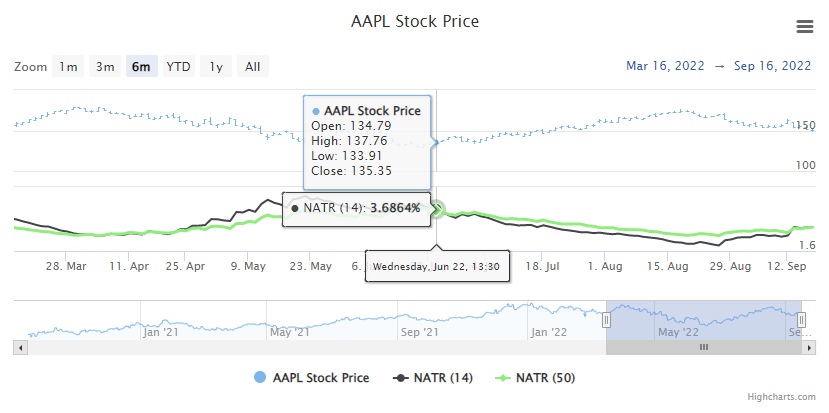
Normalized Average True Range
(NATR)
highcharts_stock.options.plot_options.atr.NATROptions
highcharts_stock.options.series.atr.NATRSeries
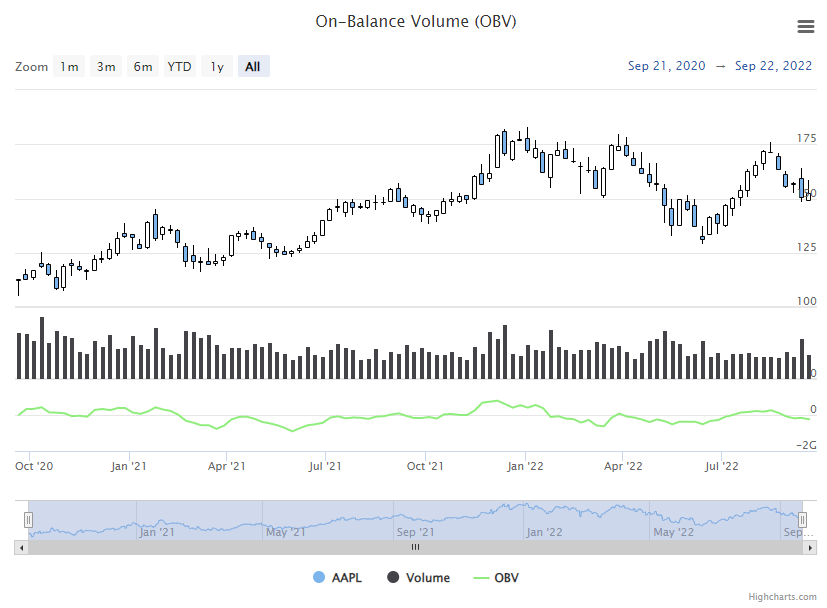
On-Balance Volume
(OBV)
highcharts_stock.options.plot_options.momentum.OBVOptions
highcharts_stock.options.series.momentum.OBVSeries
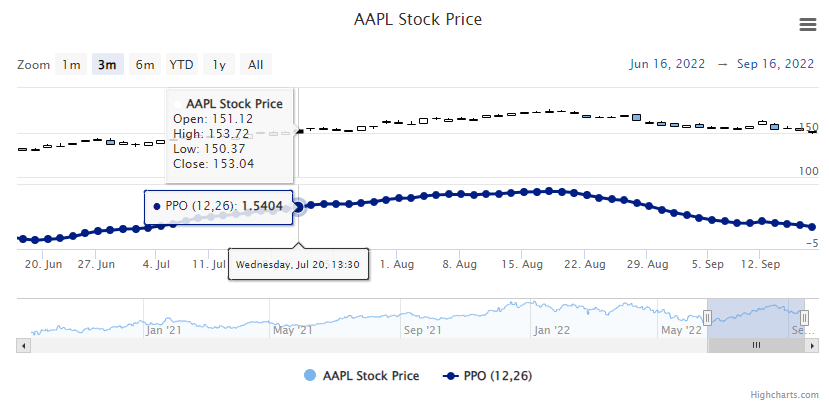
Percentage Price Oscillator
(PPO)
highcharts_stock.options.plot_options.oscillators.ppo.PPOOptions
highcharts_stock.options.series.oscillators.ppo.PPOSeries
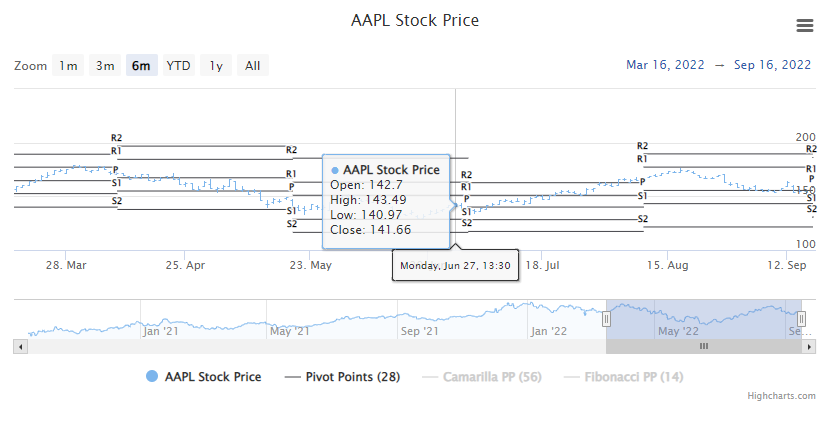
Pivot Points
highcharts_stock.options.plot_options.pivot_points.PivotPointsOptions
highcharts_stock.options.series.pivot_points.PivotPointsSeries
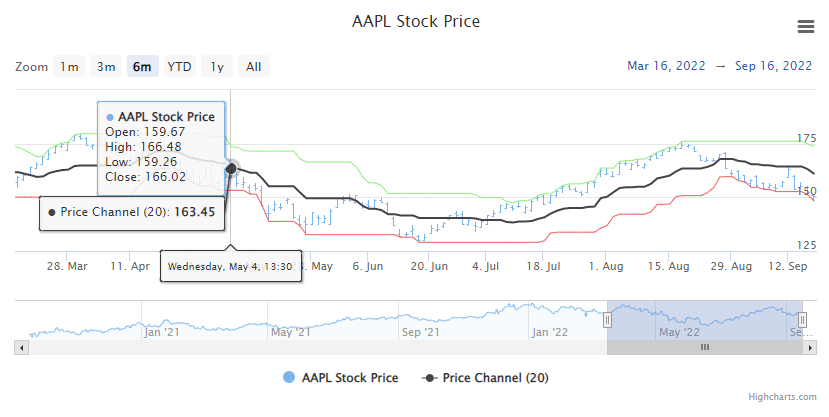
Price Channel
highcharts_stock.options.plot_options.abands.PCOptions
highcharts_stock.options.series.abands.PCSeries
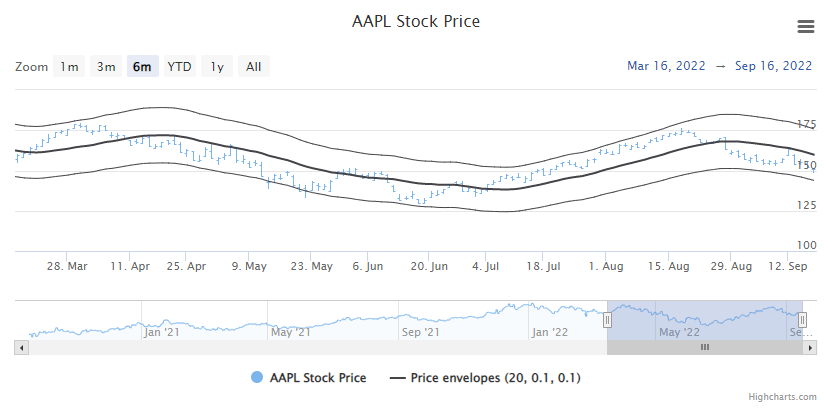
Price Envelopes
highcharts_stock.options.plot_options.price_envelopes.PriceEnvelopesOptions
highcharts_stock.options.series.price_envelopes.PriceEnvelopesSeries
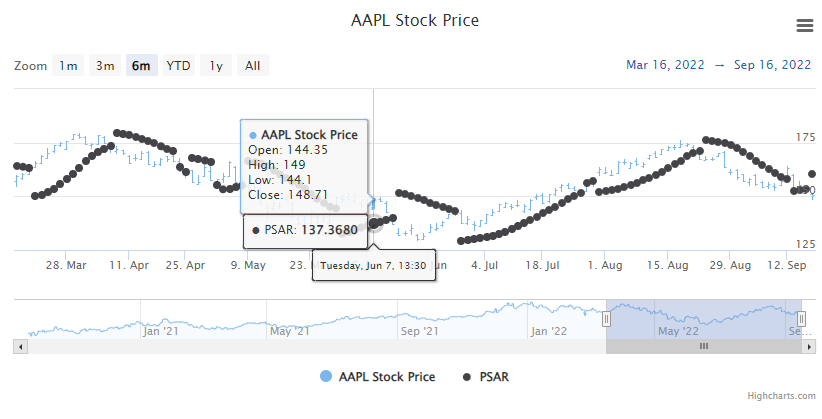
Parabolic SAR
(PSAR)
highcharts_stock.options.plot_options.psar.PSAROptions
highcharts_stock.options.series.psar.PSARSeries
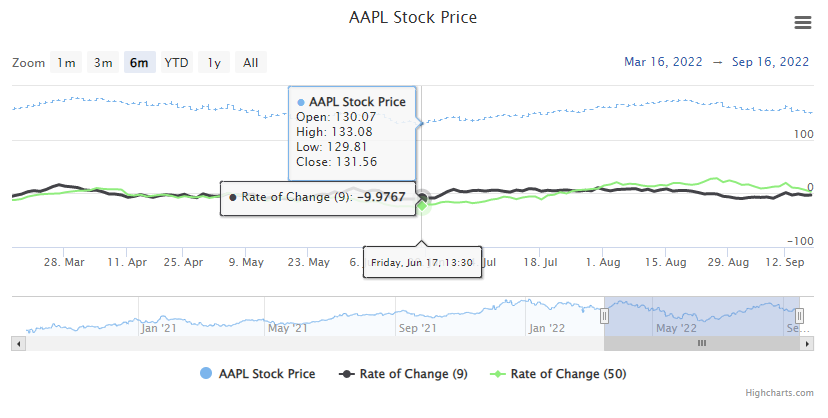
Rate of Change
(ROC)
highcharts_stock.options.plot_options.momentum.ROCOptions
highcharts_stock.options.series.momentum.ROCSeries
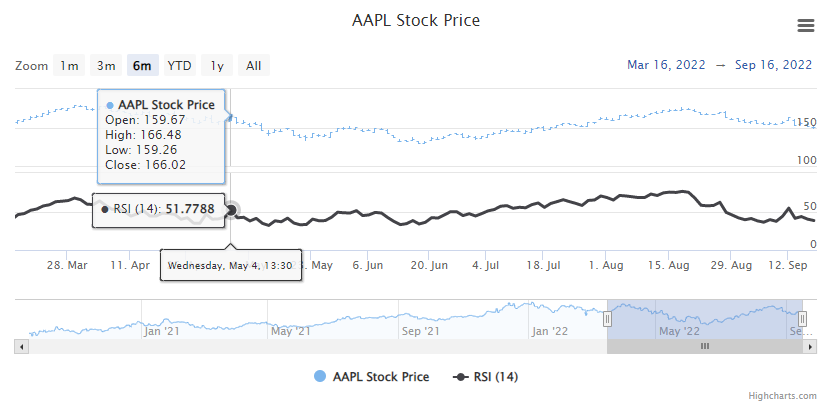
Relative Strength Index
(RSI)
highcharts_stock.options.plot_options.momentum.RSIOptions
highcharts_stock.options.series.momentum.RSISeries
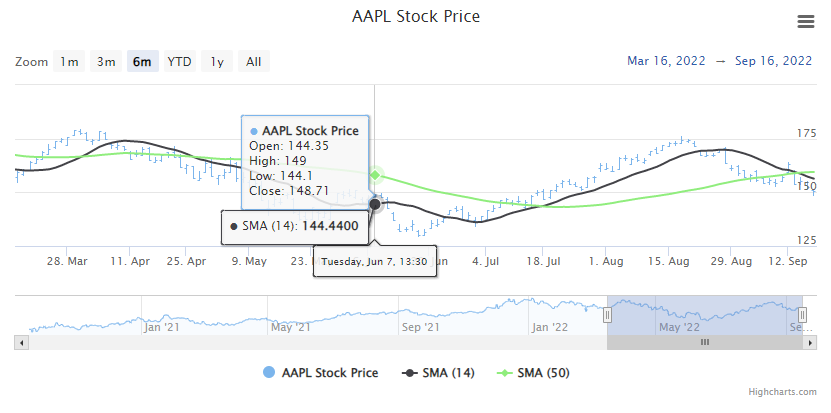
Simple Moving
Average
(SMA)
highcharts_stock.options.plot_options.averages.SMAOptions
highcharts_stock.options.series.averages.SMASeries
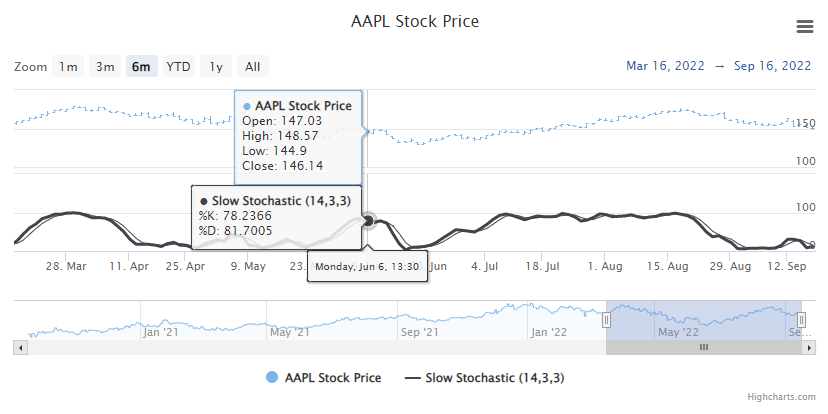
Slow Stochastic
Oscillator
highcharts_stock.options.plot_options.oscillators.stochastic.SlowStochasticOptions
highcharts_stock.options.series.oscillators.stochastic.SlowStochasticSeries
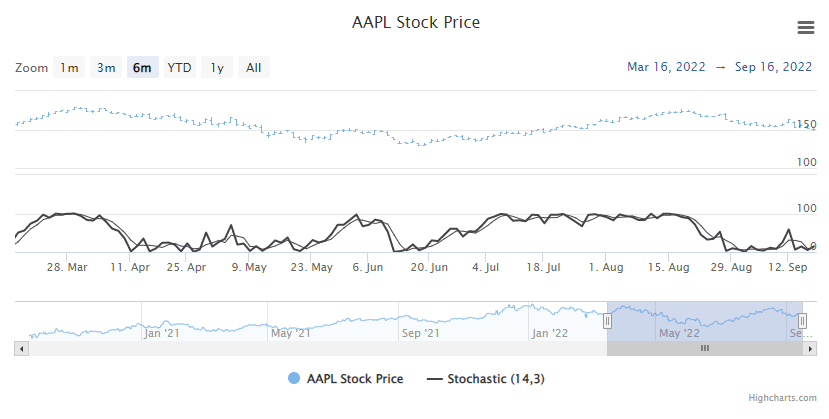
Stochastic Oscillator
highcharts_stock.options.plot_options.oscillators.stochastic.StochasticOptions
highcharts_stock.options.series.oscillators.stochastic.StochasticSeries
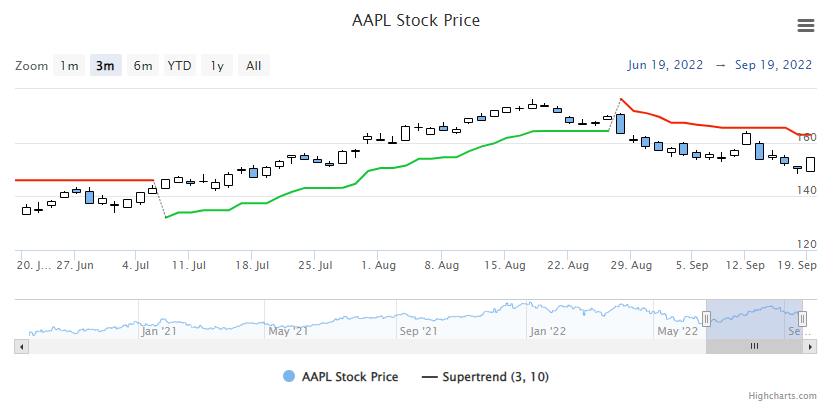
Supertrend
highcharts_stock.options.plot_options.momentum.supertrend.SupertrendOptions
highcharts_stock.options.series.momentum.supertrend.SupertrendSeries
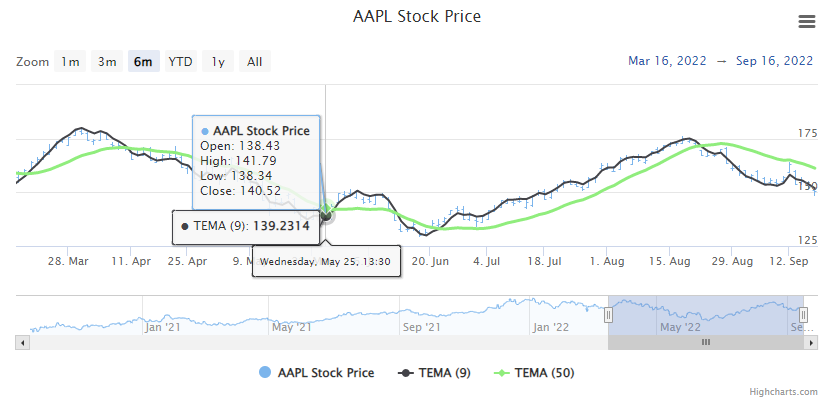
Triple Exponential
Moving Average
(TEMA)
highcharts_stock.options.plot_options.averages.TEMAOptions
highcharts_stock.options.series.averages.TEMASeries
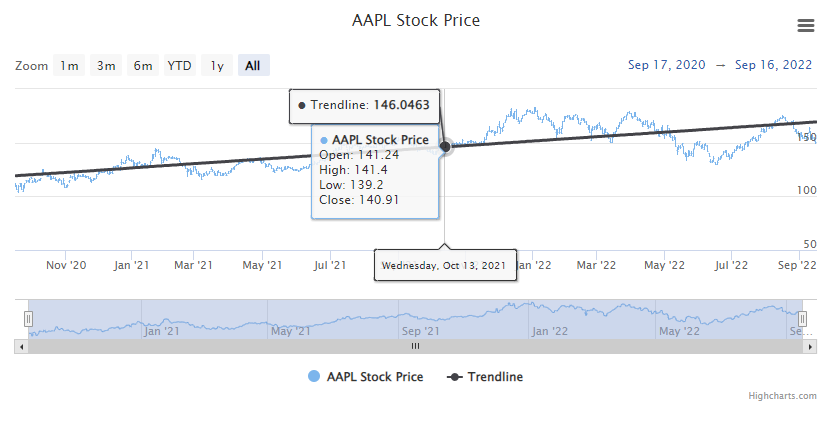
Trendline
highcharts_stock.options.plot_options.linear_regressions.TrendlineOptions
highcharts_stock.options.series.linear_regressions.TrendlineSeries
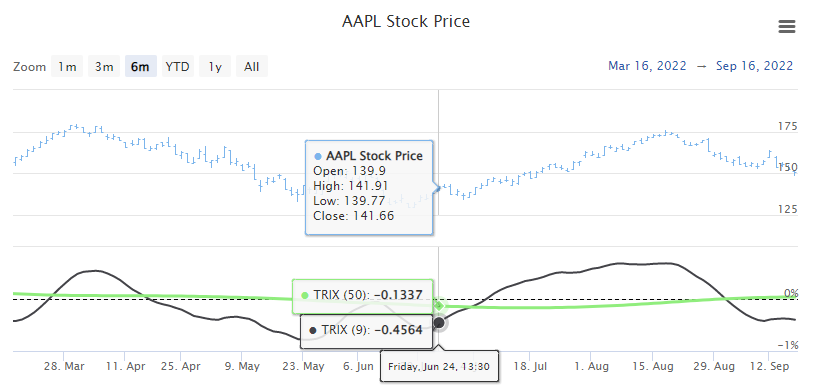
Triple Exponential
Average Oscillator
(TRIX)
highcharts_stock.options.plot_options.oscillators.TRIXOptions
highcharts_stock.options.series.oscillators.TRIXSeries
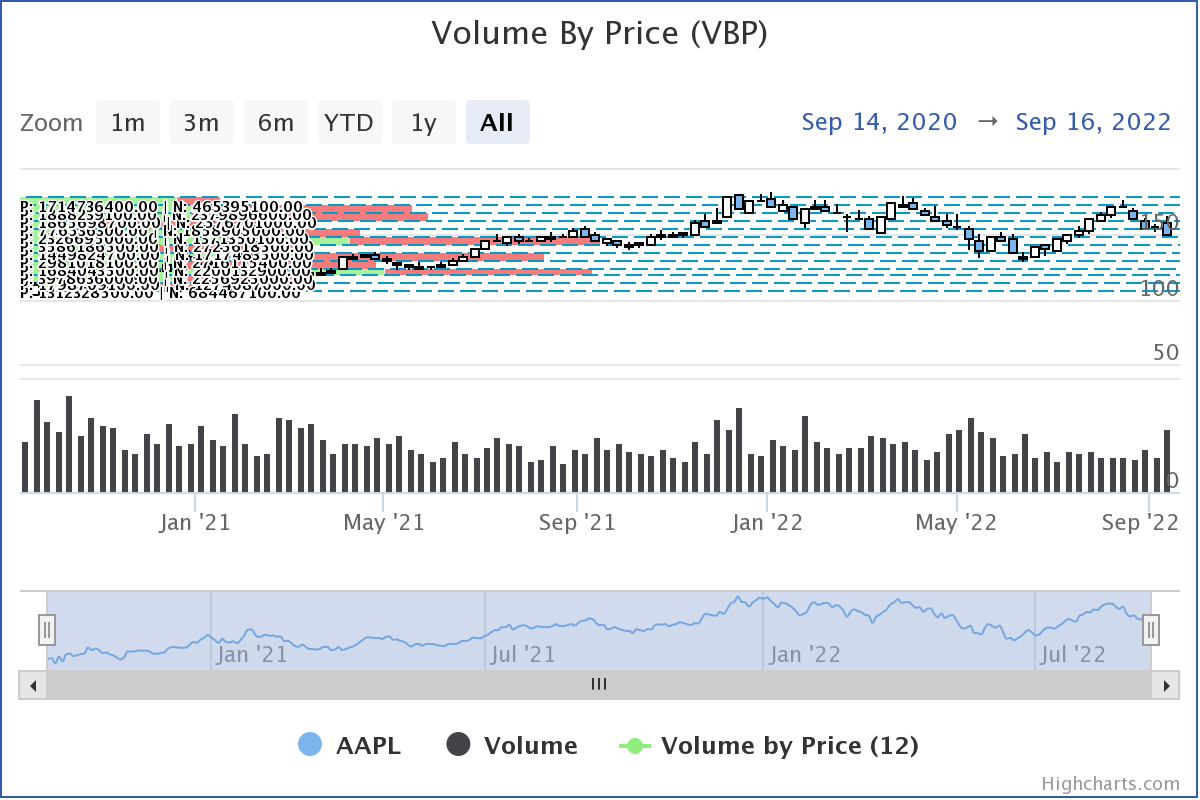
Volume-by-Price
(VBP)
highcharts_stock.options.plot_options.vbp.VBPOptions
highcharts_stock.options.series.vbp.VBPSeries
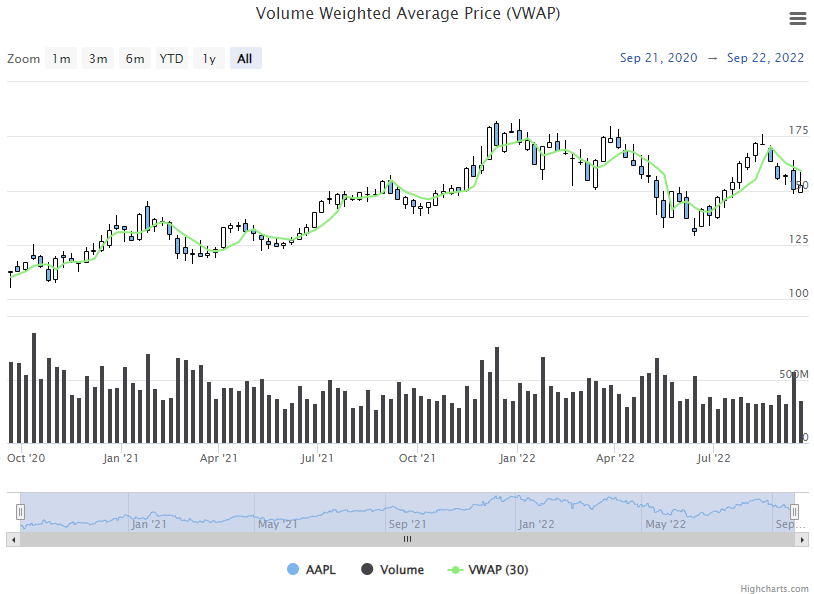
Volume Weighted
Average Price
(VWAP)
highcharts_stock.options.plot_options.averages.VWAPOptions
highcharts_stock.options.series.averages.VWAPSeries
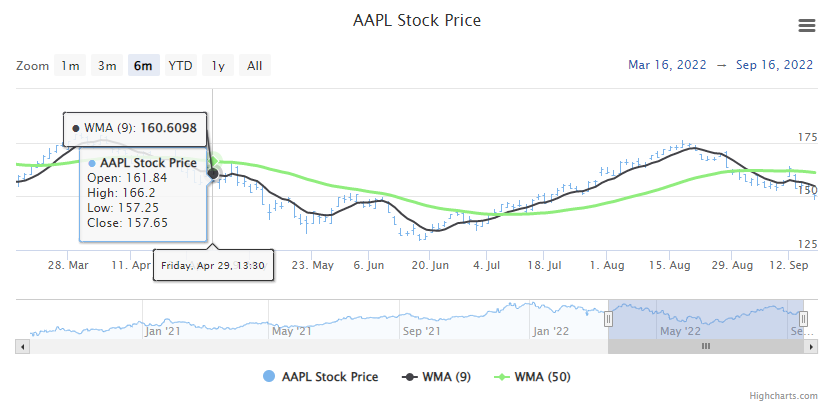
Weighted Moving
Average
(WMA)
highcharts_stock.options.plot_options.averages.WMAOptions
highcharts_stock.options.series.averages.WMASeries
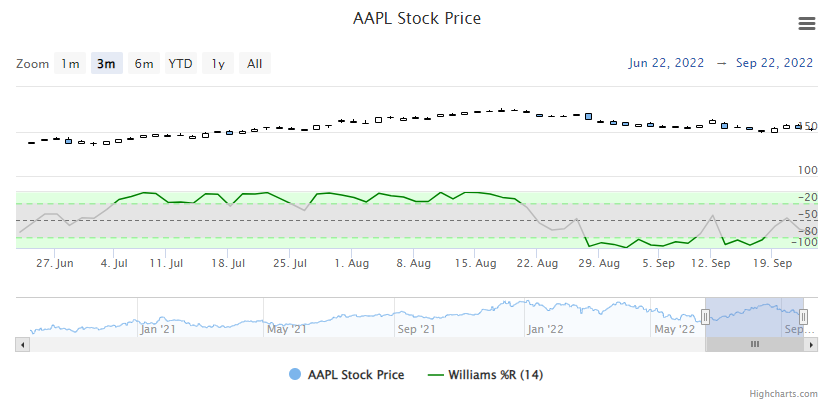
Williams %R
highcharts_stock.options.plot_options.oscillators.WilliamsROptions
highcharts_stock.options.series.oscillators.WilliamsRSeries
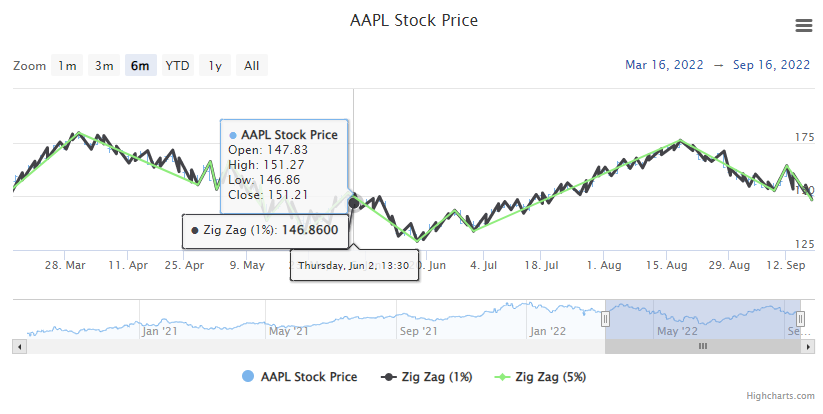
ZigZag
highcharts_stock.options.plot_options.zigzag.ZigZagOptions
highcharts_stock.options.series.zigzag.ZigZagSeries