Using Highcharts Gantt for Python
Introduction to Highcharts Stock and Highcharts for Python
Highcharts Gantt is a powerful JavaScript data visualization library for timeline and Gantt chart visualization enabling you to design rich, beautiful, and highly interactive data visualizations of (almost) any kind imaginable, and to render those visualizations in your web or mobile applications. Take a look at some of the customer showcases and demo gallery to see some examples of what you can do with Highcharts Gantt.
Highcharts Gantt for Python is a Python wrapper for the Highcharts Gantt JavaScript library, which means that it is designed to give developers working in Python a simple and Pythonic way of interacting with Highcharts Maps (JS).
Highcharts Gantt for Python will not render data visualizations itself - that’s what Highcharts Gantt (JS) does - but it will allow you to:
Configure your data visualizations in Python.
Supply data you have in Python to your data visualizations.
Programmatically produce the Highcharts Gantt JavaScript code that will actually render your data visualization.
Programmatically download a static version of your visualization (as needed) within Python.
Tip
Think of Highcharts Gantt for Python as a translator to bridge your data visualization needs between Python and JavaScript.
Key Design Patterns in Highcharts for Python
Highcharts is a large, robust, and complicated JavaScript library. If in doubt, take a look at its extensive documentation and in particular its API reference [2].
Because the Highcharts for Python Toolkit wraps the Highcharts (JS) API, its design is heavily shaped by Highcharts JS’ own design - as one should expect.
However, one of the main goals of the Python toolkit is to make it easier for Python developers to leverage the Highcharts JavaScript libraries - in particular by providing a more Pythonic way of interacting with the framework.
Here are the notable design patterns that have been adopted that you should be aware of:
Code Style: Python vs JavaScript Naming Conventions
There are only two hard things in Computer Science: cache invalidation and naming things. – Phil Karlton
Highcharts Stock is a JavaScript library, and as such it adheres to the code conventions
that are popular (practically standard) when working in JavaScript. Chief among these
conventions is that variables and object properties (keys) are typically written in
camelCase.
A lot of (digital) ink has been spilled writing about the pros and cons of camelCase
vs snake_case. While I have a scientific evidence-based opinion on the matter, in
practice it is simply a convention that developers adopt in a particular programming
language. The issue, however, is that while JavaScript has adopted the camelCase
convention, Python generally skews towards the snake_case convention.
For most Python developers, using snake_case is the “default” mindset. Most of your
Python code will use snake_case. So having to switch into camelcase to interact
with Highcharts Stock forces us to context switch, increases cognitive load, and is an
easy place for us to overlook things and make a mistake that can be quite annoying to
track down and fix later.
Therefore, when designing the Highcharts for Python Toolkit, we made several carefully considered design choices when it comes to naming conventions:
All Highcharts for Python classes follow the Pythonic
PascalCaseclass-naming convention.All Highcharts for Python properties and methods follow the Pythonic
snake_caseproperty/method/variable/function-naming convention.All inputs to properties and methods support both
snake_caseandcamelCase(akamixedCase) convention by default.This means that you can take something directly from Highcharts JavaScript code and supply it to the Highcharts for Python Toolkit without having to convert case or conventions. But if you are constructing and configuring something directly in Python using explicit deserialization methods, you can use
snake_caseif you prefer (and most Python developers will prefer).For example, if you supply a JSON file to a
from_json()method, that file can leverage Highcharts (JS) naturalcamelCaseconvention OR Highcharts for Python’ssnake_caseconvention.Warning
Note that this dual-convention support only applies to deserialization methods and does not apply to the Highcharts for Python
__init__()class constructors. All__init__()methods expectsnake_caseproperties to be supplied as keywords.All outputs from serialization methods (e.g.
to_dict()orto_js_literal()) will produce outputs that are Highcharts (JS)-compatible, meaning that they apply thecamelCaseconvention.
Tip
Best Practice
If you are using external files to provide templates or themes for your Highcharts
data visualizations, produce those external files using Highcharts JS’ natural
camelCase convention. That will make it easier to re-use them elsewhere within a
JavaScript context if you need to in the future.
Standard Methods
Every single object supported by the Highcharts JavaScript API corresponds to a Python class in Highcharts Gantt for Python. You can find the complete list in our comprehensive Highcharts Gantt for Python API Reference.
These classes generally inherit from the
HighchartsMeta metaclass, which
provides each class with a number of standard methods. These methods are the “workhorses”
of Highcharts Gantt for Python and you will be relying heavily on them when
using the library. Thankfully, their signatures and behavior is generally consistent -
even if what happens “under the hood” is class-specific at times.
The standard methods exposed by the classes are:
Deserialization Methods
- classmethod from_js_literal(cls, as_string_or_file, allow_snake_case=True)
Convert a JavaScript object defined using JavaScript object literal notation into a Highcharts for Python Python object, typically descended from
HighchartsMeta.
- Parameters:
cls (
type) – The class object itself.as_string_or_file (
str) – The JavaScript object you wish to convert. Expects either astrcontaining the JavaScript object, or a path to a file which consists of the object.allow_snake_case (
bool) – IfTrue, allows keys inas_string_or_fileto apply thesnake_caseconvention. IfFalse, will ignore keys that apply thesnake_caseconvention and only process keys that use thecamelCaseconvention. Defaults toTrue.- Returns:
A Highcharts for Python object corresponding to the JavaScript object supplied in
as_string_or_file.- Return type:
Descendent of
HighchartsMeta
- classmethod from_json(cls, as_json_or_file, allow_snake_case=True)
Convert a Highcharts JS object represented as JSON (in either
strorbytesform, or as a file name) into a Highcharts for Python object, typically descended fromHighchartsMeta.
- Parameters:
cls (
type) – The class object itself.as_json_or_file (
strorbytes) – The JSON object you wish to convert, or a filename that contains the JSON object that you wish to convert.allow_snake_case (
bool) – IfTrue, allows keys inas_jsonto apply thesnake_caseconvention. IfFalse, will ignore keys that apply thesnake_caseconvention and only process keys that use thecamelCaseconvention. Defaults toTrue.- Returns:
A Highcharts for Python Python object corresponding to the JSON object supplied in
as_json.- Return type:
Descendent of
HighchartsMeta
- classmethod from_dict(cls, as_dict, allow_snake_case=True)
Convert a
dictrepresentation of a Highcharts JS object into a Python object representation, typically descended fromHighchartsMeta.
Serialization Methods
- to_js_literal(self, filename=None, encoding='utf-8')
Convert the Highcharts Gantt for Python instance to Highcharts Gantt-compatible JavaScript code using JavaScript object literal notation.
- Parameters:
- Returns:
Highcharts Gantt-compatible JavaScript code using JavaScript object literal notation.
- Return type:
- to_json(self, filename=None, encoding='utf-8')
Convert the Highcharts Gantt for Python instance to Highcharts Gantt-compatible JSON.
Warning
While similar, JSON is inherently different from JavaScript object literal notation. In particular, it cannot include JavaScript functions. This means if you try to convert a Highcharts for Python object to JSON, any properties that are
CallbackFunctioninstances will not be included. If you want to convert those functions, please use.to_js_literal()instead.
- Parameters:
- Returns:
Highcharts Gantt-compatible JSON representation of the object.
- Return type:
Note
Highcharts Gantt for Python works with different JSON encoders. If your environment has orjson, for example, the result will be returned as a
bytesinstance. Otherwise, the library will fallback to various other JSON encoders until finally falling back to the Python standard library’s JSON encoder/decoder.
Other Convenience Methods
- copy(self, other, overwrite=True, **kwargs)
Copy the properties from
selftoother.
- Parameters:
other (
HighchartsMeta) – The target instance to which the properties of this instance should be copied.overwrite (
bool) – ifTrue, properties inotherthat are already set will be overwritten by their counterparts inself. Defaults toTrue.kwargs – Additional keyword arguments. Some special descendants of
HighchartsMetamay have special implementations of this method which rely on additional keyword arguments.- Returns:
A mutated version of
otherwith new property values- Raises:
HighchartsValueError – if
otheris not the same class as (or subclass of)self
Handling Default Values
Explicit is better than implicit. – The Zen of Python
Highcharts Gantt has a lot of default
values. These default values are generally applied if a JavaScript property is
undefined (missing or otherwise not specified), which is different from the JavaScript
value of null.
While the Pythonic instinct is to:
indicate those default values explicitly in the Highcharts for Python code as keyword argument defaults, and
return those default values in the serialized form of any Highcharts for Python objects
doing so would introduce a massive problem: It would bloat data transferred on the wire unnecessarily.
The way that Highcharts Gantt handles defaults is an elegant compromise between explicitness and the practical reality of making your code readable. Why make a property explicit in a configuration string if you don’t care about it? Purity is only valuable to a point. And with thousands of properties across the Highcharts Core and Highcharts Gantt libraries, nobody wants to transmit or maintain thousands of property configurations if it can be avoided.
For that reason, the Highcharts for Python toolkit explicitly breaks Pythonic
convention: when an object’s property returns None, that has the
equivalent meaning of “Highcharts JS/Stock will apply the Highcharts default for this
property”. These properties will not be serialized, either to a JS literal, nor to a
dict, nor to JSON. This has the advantage of maintaining consistent
behavior with Highcharts Core and
Highcharts Gantt while still providing an
internally consistent logic to follow.
Module Structure
The structure of the Highcharts Gantt for Python library closely matches the structure of the Highcharts Gantt options object (see the relevant reference documentation).
At the root of the library - importable from highcharts_gantt - you will find the
highcharts_gantt.highcharts module. This module is a catch-all importable module,
which allows you to easily access the most-commonly-used Highcharts Gantt for Python
classes and modules.
Note
Whlie you can access all of the Highcharts Gantt for Python classes from
highcharts_gantt.highcharts, if you want to more precisely navigate to specific
class definitions you can do fairly easily using the module organization and naming
conventions used in the library.
This is the recommended best practice to maximize performance.
In the root of the highcharts_gantt library you can find universally-shared
class definitions, like .metaclasses which
contains the HighchartsMeta
and JavaScriptDict
definitions, or .decorators which define
method/property decorators that are used throughout the library.
The .utility_classes module contains class
definitions for classes that are referenced or used throughout the other class
definitions.
And you can find the Highcharts Gantt options object and all of its
properties defined in the .options module, with
specific (complicated or extensive) sub-modules providing property-specific classes
(e.g. the .options.plot_options
module defines all of the different configuration options for different series types,
while the .options.series module defines all
of the classes that represent series of data in a given chart).
Class Structures and Inheritance
Highcharts Gantt objects re-use many of
the same properties. This is one of the strengths of the Highcharts API, in that it is
internally consistent and that behavior configured on one object should be readily
transferrable to a second object provided it shares the same properties. However,
Highcharts Gantt has a lot of properties. For example, I estimate that
the options.plotOptions objects and their sub-properties have close to 3,000
properties. But because they are heavily repeated, those 3,000 or so properties can be
reduced to only 421 unique property names. That’s almost an 85% reduction.
DRY is an important principle in software development. Can you imagine propagating changes in seven places (on average) in your code? That would be a maintenance nightmare! And it is exactly the kind of maintenance nightmare that class inheritance was designed to fix.
For that reason, the Highcharts for Python toolkit’s classes have a deeply nested
inheritance structure. This is important to understand both for evaluating
isinstance() checks in your code, or for understanding how to
further subclass Highcharts for Python components.
See also
For more details, please review the API documentation, in particular the class inheritance diagrams included for each documented class.
Warning
Certain sections of Highcharts Gantt for Python - in particular the
options.series classes - rely heavily on
multiple inheritance. This is a known anti-pattern in Python development as it runs the
risk of encountering the diamond of death inheritance problem. This complicates
the process of inheriting methods or properties from parent classes when properties or
methods share names across multiple parents.
We know the diamond of death is an anti-pattern, but it was a necessary one to minimize code duplication and maximize consistency. For that reason, we implemented it properly despite the anti-pattern, using some advanced Python concepts to navigate the Python MRO (Method Resolution Order) system cleanly. However, an awareness of the pattern used may prove helpful if your code inherits from the Highcharts for Python classes.
See also
For a more in-depth discussion of how the anti-pattern was implemented safely and reliably, please review the Contributor Guidelines.
Organizing Your Highcharts for Python Project
Highcharts Gantt for Python is a utility that can integrate with - quite literally - any frontend framework. Whether your Python application is relying on iPython (e.g. Jupyter Notebook [3] or Jupyter Labs [3]), Flask, Django, FastAPI, Pyramid, Tornado, or some completely home-grown solution all Highcharts Gantt for Python needs is a place where Highcharts Gantt JavaScript code can be executed.
All of those frameworks mentioned have their own best practices for organizing their application structures, and those should always take priority. Even in a data-centric application that will be relying heavily on Highcharts Gantt for Python, your application’s core business logic will be doing most of the heavy lifting and so your project’s organization should reflect that.
However, there are a number of best practices that we recommend for organizing your files and code to work with Highcharts Gantt for Python:
Warning
There are nine and sixty ways of constructing a tribal lay, and every single one of them is right! – Rudyard Kipling, In the Neolithic Age
The organizational model described below is just a suggestion, and you can (and likely will) depart from its principles and practices as you gain more experience using Highcharts Gantt for Python. There’s nothing wrong with that! It’s just a set of best practices that we’ve found work for us and which we therefore recommend.
Importing Highcharts Gantt for Python
Tip
Best Practice!
This method of importing Highcharts Gantt for Python objects yields the fastest
performance for the import statement. However, it is more verbose and requires
you to navigate the extensive Highcharts Gantt for Python API.
# Import classes using precise module indications. For example:
from highcharts_gantt.chart import Chart
from highcharts_gantt.global_options.shared_options import SharedGanttOptions
from highcharts_gantt.options import HighchartsGanttOptions
from highcharts_gantt.options.plot_options.gantt import GanttOptions
from highcharts_gantt.options.series.gantt import GanttSeries
Caution
This method of importing Highcharts Gantt for Python classes has relatively slow performance because it imports hundreds of different classes from across the entire library. This performance impact may be acceptable to you in your use-case, but do use at your own risk.
# Import objects from the catch-all ".highcharts" module.
from highcharts_gantt import highcharts

# You can now access specific classes without individual import statements.
highcharts.Chart
highcharts.SharedGanttOptions
highcharts.HighchartsGanttOptions
highcharts.GanttOptions
highcharts.GanttSeries
Use Templates to Get Started
While shared options are applied to all charts that are rendered
on the same web page with the shared options JS code, certain types of visualizations
may need special treatment. Sure, you can use the
plot_options settings to configure chart
type-specific options, but how can you efficiently use multiple charts of the same type
that have different settings?
For example, let’s say you used shared options to set universal bar chart settings. But what happens if you know you’ll have different data shown in different bar charts? You can use a similar templating pattern for different sub-types of your charts.
Tip
Best practice!
We really like to use JS literals written as separate files in our codebase. It makes it super simple to instantiate a Highcharts Gantt for Python instance with one method call.
Let’s say you organize your files like so:
my_repository/| — docs/| — my_project/| —— project_resources/| ——— image_files/| ——— data_files/| ———— data-file-01.csv| ———— data-file-02.csv| ———— data-file-03.csv| ——— highcharts_config/| ———— shared_options.js| ———— hlc-template-01.js| ———— hlc-template-02.js| ———— line-template.js| ———— packed-bubble-template.js| —— some_package/| ——— __init__.py| ——— package_module.py| ——— another_module.py| —— __init__.py| —— __version__.py| —— some_module.py| — tests/| — .gitignore| — requirements.txt
As you can see, there are two JS literal files named hlc-template-01.js and
hlc-template-02.js respectively. These template files can be used to significantly
accelerate the configuration of our bar charts. Each template corresponds to one
sub-type of bar chart that we know we will need. These sub-types may have different
event functions, or more frequently use different formatting functions to make the
data look the way we want it to look.
Now with these template files, we can easily create a pair of
Chart instances by executing:
from highcharts_gantt.highcharts import Chart
from highcharts_gantt.options.series.hlc import HLCSeries

type_1_chart = Chart.from_js_literal(
    '../../project_resources/highcharts_config/hlc-template-01.js'
)
type_2_chart = Chart.from_js_literal(
    '../../project_resources/highcharts_config/hlc-template-02.js'
)
And that’s it! Now you have two chart instances which you can further modify. For example, you can add data to them by calling:
type_1_chart.container = 'chart1_div'
type_2_chart.container = 'chart2_div'

type_1_chart.add_series(HLCSeries.from_csv('../../project_resources/data_files/data-file-01.csv'))
type_2_chart.add_series(HLCSeries.from_csv('../../project_resources/data_files/data-file-02.csv'))
And then you can create the relevant JavaScript code to render the chart using:
type_1_chart_js = type_1_chart.to_js_literal()
type_2_chart_js = type_2_chart.to_js_literal()
And now you can deliver type_1_chart_js and type_2_chart_js to your HTML
template or wherever it will be rendered.
You can use the same exact pattern as using a JS literal with a JSON file instead. We don’t really think there’s an advantage to this - but there might be one significant disadvantage: JSON files cannot be used to provide JavaScript functions to your Highcharts configuration. This means that formatters, event handlers, etc. will not be applied through your shared options if you use a JSON file.
If your chart templates don’t require JavaScript functions? Then by all means, feel
free to use a JSON file and the .from_json() method instead of the
.from_js_literal() method.
Tip
In practice, we find that most chart templates differ in their formatter functions and event handlers. This makes JSON a particularly weak tool for templating those charts. We strongly prefer the JS literal method described above.
If you are hoping to configure a simple set of template settings, one of the fastest
ways to do so in your Python code is to instantiate your
Chart instance from a simple
dict using the .from_dict() method.
Tip
This method is particularly helpful and easy to maintain if you are only using a very small subset of the Highcharts JS configuration options.
If you have an existing Highcharts Gantt for Python instance, you can copy its
properties to another object using the .copy() method. You can therefore set up
one chart, and then copy its properties to other chart objects with one method call.
type_1_chart = Chart.from_js_literal('../../project_resources/highcharts_config/hlc-template-01.js')
other_chart = type_1_chart.copy(other_chart, overwrite = True)
Tip
The
Chart.copy()method supports a special keyword argument,preverse_datawhich if set toTruewill copy properties (unlessoverwrite = False) but will not overwrite any data. This can be very useful to replicating the configuration of your chart across multiple charts that have different series and data.other_chart = Chart() other_chart.add_series( HLCSeries.from_csv('../../project_resources/data_files/data-file-02.csv') ) other_chart = type_1_chart.copy(other_chart, preserve_data = True)
Working with Highcharts Gantt Features
Highcharts Gantt adds numerous significant features to Highcharts Core which add significant interactivity to your visualizations. These key features are:
Stock tools are a custom toolbar that can be displayed on your chart which allows your users to interact with your chart in various ways. Using event bindings tied to the stock tools, you can toggle annotations, toggle technical indicators, or control the chart’s zoom level.
To display the stock tools in your chart, you can use the
HighchartsGanttOptions.stock_tools
setting, which can be configured using a
StockTools instance.
my_stock_tools = StockTools(gui = { 'enabled': True })
my_options = HighchartsGanttOptions(stock_tools = my_stock_tools)
my_chart = Chart.from_options(my_options)
See also
The Navigator is a small series shown below the main series which displays a zoomed-out view of the entire dataset. It allows you to zoom in / out or jump to a particular range of time in the chart.
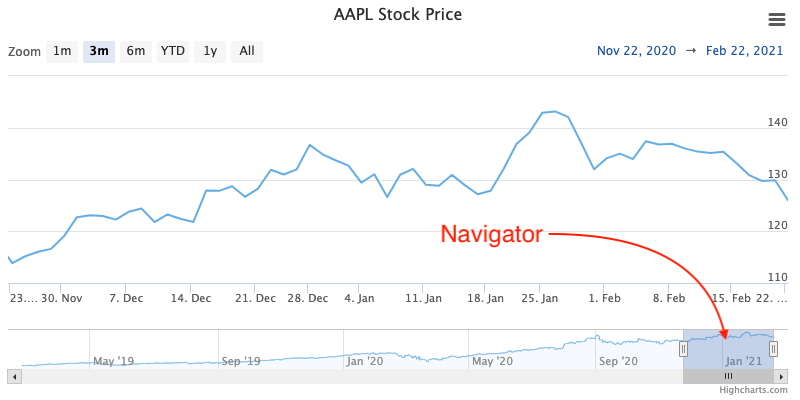
The navigator is enabled by default in Chart
instances where .is_stock_chart
is True or whose .options contain
a HighchartsStockOptions
instance.
You can configure how the navigator is rendered using several different methods:
You can configure whether individual series are shown in the navigator by setting their
.show_in_navigatorproperty toTrue(to show) orFalse(to hide)You can configure how the series is rendered within the navigator by setting their
.navigator_optionsproperty.You can set general navigator options for the series type by setting their
PlotOptions.<SERIES TYPE>.show_in_navigatorandPlotOptions.<SERIES TYPE>.navigator_optionsproperties.You can set overall configuration settings for the entire navigator using the
HighchartsStockOptions.navigatorsetting.
See also
The Range Selector is a small tool displayed above (or beside) the visualization which allows the user to pre-select the time range that is displayed on the chart.
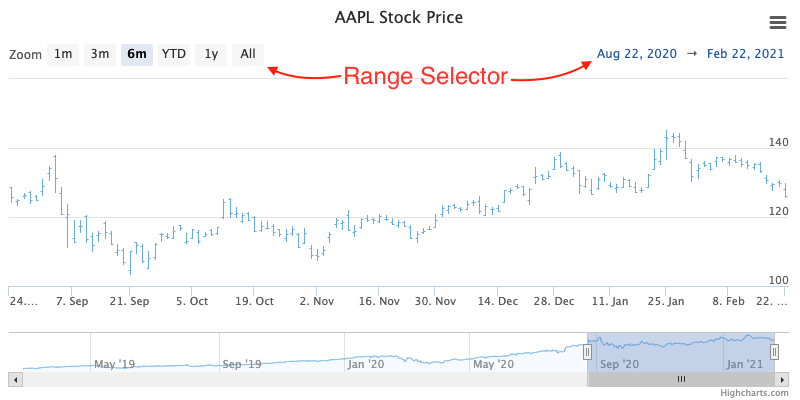
Based upon its configuration (via the
HighchartsGanttOptions.range_selector or HighchartsStockOptions.range_selector
properties), it can display a series of buttons that allow the user to zoom to a
specific granularity (e.g. display one day’s worth of data, display one week’s worth
of data, display one month’s worth of data, etc.) and can provide the user with inputs
to select the range (start date / end date) which should be displayed.
Note
By default, the range selector is rendered in a responsive fashion. If there is not
enough room to display the entire selector in a single row, it will collapse into a
dropdown configuration based on the
RangeSelector.dropdown
setting.
See also
Working with Data
Obviously, if you are going to use Highcharts Gantt for Python and Highcharts Gantt you will need to have data to visualize. Python is rapidly becoming the lingua franca in the world of data manipulation, transformation, and analysis and Highcharts Gantt for Python is specifically designed to play well within that ecosystem to make it easy to visualize data from your Asana projects, Monday.com boards, Jira projects, CSV files, from `pandas`_ dataframes, or PySpark [1] dataframes.
How Data is Represented
Highcharts (JS) supports two different ways of representing data: as an individual series comprised of individual data points, and as a set of instructions to read data dynamically from a CSV file or an HTML table.
See also
DataBaseclass
options.Dataclass
Highcharts organizes data into series. You can think of a series as a single line on a graph that shows a set of values. The set of values that make up the series are data points, which are defined by a set of properties that indicate the data point’s position on one or more axes.
As a result, Highcharts (JS) and
Highcharts for Python both represent the data points in series as a list of data point
objects in the data property within the series:
Highcharts (JS)
Highcharts for Python
As a single
DataPointCollectionobject in thedataproperty within the series, which in turn contains the individual data points.
Highcharts (JS)
Highcharts for Python
As you can see, Highcharts for Python represents its data the same way that
Highcharts (JS) does. That should be expected.
However, constructing tens, hundreds, or possibly thousands of data points
individually in your code would be a nightmare. For that reason, the
Highcharts for Python Toolkit natively supports vectorized
numpy.ndarray values, and automatically assembles data
point collections for easy management/manipulation. In addition, the Toolkit
provides a number of convenience methods to make it easier to populate your
series.
Populating Series Data
Every single Series class in Highcharts Gantt for Python features several different methods to either instantiate data points directly, load data (to an existing series instance), or to create a new series instance with data already loaded.
Warning
Technical indicators do not support the .from_array() method because
their data gets populated dynamically based on the series indicated in their
.linked_to
property.
When working with a series instance, you can instantiate data points directly.
These data points are stored in the
.data setting, which
always accepts/expects a list of data point instances (descended from
DataBase).
Data points all have the same standard Highcharts for Python deserialization methods, so those make things very easy. However, they also have a special data point-specific deserialization method:
Warning
Technical indicators provided by
Highcharts Stock for Python do not support the .load_from_* methods because
their data gets populated dynamically based on the series indicated in their
.linked_to
property.
# EXAMPLE 1
# A simple array of numerical values which correspond to the Y value of the data
# point

my_series.load_from_array([0, 5, 3, 5])

# EXAMPLE 2
# An array containing 2-member arrays (corresponding to the X and Y values of the
# data point)

my_series.load_from_array([
    [0, 0],
    [1, 5],
    [2, 3],
    [3, 5]
])

# EXAMPLE 3
# An array of dict with named values

my_series.load_from_array([
  {
      'x': 0,
      'y': 0,
      'name': 'Point1',
      'color': '#00FF00'
  },
  {
      'x': 1,
      'y': 5,
      'name': 'Point2',
      'color': '#CCC'
  },
  {
      'x': 2,
      'y': 3,
      'name': 'Point3',
      'color': '#999'
  },
  {
      'x': 3,
      'y': 5,
      'name': 'Point4',
      'color': '#000'
  }
])

# EXAMPLE 5
# using a NumPy ndarray named "numpy_array"

my_series.load_from_array(numpy_array)
Method Signature
- classmethod load_from_array(cls, value)
Update the series instance’s
dataproperty with data populated from an array-likevalue.This method is specifically used to parse data that is input to Highcharts for Python without property names, in an array-organized structure as described in the Highcharts JS documentation.
See also
The specific structure of the expected array is highly dependent on the type of data point that the series needs, which itself is dependent on the series type itself.
Please review the detailed series documentation for series type-specific details of relevant array structures.
- Parameters:
value (iterable) –
The value that should contain the data which will be converted into data point instances.
Note
If
valueis not an iterable, it will be converted into an iterable to be further de-serialized correctly.
# Given a LineSeries named "my_series", and a CSV file named "updated-data.csv"

my_series.load_from_csv('updated-data.csv')

# For more precise control over how the CSV data is parsed,
# you can supply a mapping of series properties to their CSV column
# either by index position *or* by column header name.

my_series.load_from_csv('updated-data.csv',
                        property_column_map = {
                            'x': 0,
                            'y': 3,
                            'id': 'id'
                        })
Method Signature
- .load_from_csv(self, as_string_or_file, property_column_map=None, has_header_row=True, delimiter=',', null_text='None', wrapper_character="'", line_terminator='\r\n', wrap_all_strings=False, double_wrapper_character_when_nested=False, escape_character='\\', series_in_rows='line', series_index=None, **kwargs)
Updates the series instance with a collection of data points (descending from
DataBase) fromas_string_or_fileby traversing the rows of data and extracting the values from the columns indicated inproperty_column_map.Warning
This method will overwrite the contents of the series instance’s
dataproperty.Note
For an example
LineSeries, the minimum code required would be:my_series = LineSeries() # Minimal code - will attempt to update the line series # taking x-values from the first column, and y-values from # the second column. If there are too many columns in the CSV, # will throw an error. my_series = my_series.from_csv('some-csv-file.csv') # More precise code - will attempt to update the line series # mapping columns in the CSV file to properties on the series # instance. my_series = my_series.from_csv('some-csv-file.csv', property_column_map = { 'x': 0, 'y': 3, 'id': 'id' })
As the example above shows, data is loaded into the
my_seriesinstance from the CSV file with a filenamesome-csv-file.csv. Unless otherwise specified, the.xvalues for each data point will be taken from the first (index 0) column in the CSV file, while the.yvalues will be taken from the second column.If the CSV has more than 2 columns, then this will throw an
HighchartsCSVDeserializationErrorbecause the function is not certain which columns to use to update the series. If this happens, you can precisely specify which columns to use by providing aproperty_column_mapargument, as shown in the second example. In that second example, the.xvalues for each data point will be taken from the first (index 0) column in the CSV file. The.yvalues will be taken from the fourth (index 3) column in the CSV file. And the.idvalues will be taken from a column whose header row is labeled'id'(regardless of its index).- Parameters:
as_string_or_file (
stror Path-like) –The CSV data to load, either as a
stror as the name of a file in the runtime envirnoment. If a file, data will be read from the file.Tip
Unwrapped empty column values are automatically interpreted as null (
None).property_column_map (
dict) –An optional
dictused to indicate which data point property should be set to which CSV column. The keys in thedictshould correspond to properties in the data point class, while the value can either be a numerical index (starting with 0) or astrindicating the label for the CSV column. Defaults toNone.has_header_row (
bool) – IfTrue, indicates that the first row ofas_string_or_filecontains column labels, rather than actual data. Defaults toTrue.delimiter (
str) – The delimiter used between columns. Defaults to,.wrapper_character (
str) – The string used to wrap string values when wrapping is applied. Defaults to'.null_text (
str) – The string used to indicate an empty value if empty values are wrapped. Defaults to None.line_terminator (
str) –The string used to indicate the end of a line/record in the CSV data. Defaults to
'\r\n'.Warning
The Python
csvmodule currently ignores theline_terminatorparameter and always applies'\r\n', by design. The Python docs say this may change in the future, so for future backwards compatibility we are including it here.wrap_all_strings (
bool) –If
True, indicates that the CSV file has all string data values wrapped in quotation marks. Defaults toFalse.double_wrapper_character_when_nested (
bool) – IfTrue, quote character is doubled when appearing within a string value. IfFalse, theescape_characteris used to prefix quotation marks. Defaults toFalse.escape_character (
str) – A one-character string that indicates the character used to escape quotation marks if they appear within a string value that is already wrapped in quotation marks. Defaults to\\(which is Python for'\', which is Python’s native escape character).series_in_rows (
bool) – ifTrue, will attempt a streamlined cartesian series with x-values taken from column names, y-values taken from row values, and the series name taken from the row index. Defaults toFalse.if
None, will raise aHighchartsCSVDeserializationErrorif the CSV data contains more than one series and noproperty_column_mapis provided. Otherwise, will update the instance with the series found in the CSV at theseries_indexvalue. Defaults toNone.Tip
This argument is ignored if
property_column_mapis provided.**kwargs –
Remaining keyword arguments will be attempted on the resulting series instance and the data points it contains.
- Returns:
A collection of data points descended from
DataBaseas appropriate for the series class.- Return type:
listof instances descended fromDataBase- Raises:
HighchartsDeserializationError – if unable to parse the CSV data correctly
# Given a LineSeries named "my_series", and a Pandas DataFrame variable named "df"

# EXAMPLE 1. The minimum code required to update the series:

my_series.load_from_pandas(df)

# EXAMPLE 2. For more precise control over how the ``df`` is parsed,
# you can supply a mapping of series properties to their dataframe column.

my_series.load_from_pandas(df,
                           property_map = {
                               'x': 'date',
                               'y': 'value',
                               'id': 'id'
                           })

# EXAMPLE 3. For more precise control, specify the index of the
# Highcharts for Python series instance to use in updating your series' data.

my_series.load_from_pandas(df, series_index = 3)
Method Signature
- .load_from_pandas(self, df, property_map=None, series_in_rows=False, series_index=None)
Replace the contents of the
.dataproperty with data points populated from a pandasDataFrame.- Parameters:
df (
DataFrame) – TheDataFramefrom which data should be loaded.property_map (
dict) – Adictused to indicate which data point property should be set to which column indf. The keys in thedictshould correspond to properties in the data point class, while the value should indicate the label for theDataFramecolumn.series_in_rows (
bool) – ifTrue, will attempt a streamlined cartesian series with x-values taken from column names, y-values taken from row values, and the series name taken from the row index. Defaults toFalse.series_index (
int, slice, orNone) –If supplied, return the series that Highcharts for Python generated from
dfat theseries_indexvalue. Defaults toNone, which returns all series generated fromdf.Warning
If
Noneand Highcharts for Python generates multiple series, then aHighchartsPandasDeserializationErrorwill be raised.
- Raises:
HighchartsPandasDeserializationError – if
property_mapreferences a column that does not exist in the data frameHighchartsPandasDeserializationError – if
series_indexisNone, and it is ambiguous which series generated from the dataframe should be usedHighchartsDependencyError – if pandas is not available in the runtime environment
# Given a LineSeries named "my_series", and a PySpark DataFrame variable named "df"
my_series.load_from_pyspark(df,
                            property_map = {
                                'x': 'date',
                                'y': 'value',
                                'id': 'id'
                            })
Method Signature
- .load_from_pyspark(self, df, property_map)
Replaces the contents of the
.dataproperty with values from a PySparkDataFrame.- Parameters:
df (
DataFrame) – TheDataFramefrom which data should be loaded.property_map (
dict) – Adictused to indicate which data point property should be set to which column indf. The keys in thedictshould correspond to properties in the data point class, while the value should indicate the label for theDataFramecolumn.
- Raises:
HighchartsPySparkDeserializationError – if
property_mapreferences a column that does not exist in the data frameif PySpark is not available in the runtime environment
Warning
Technical indicators provided by
Highcharts for Python do not support the .from_csv(),
.from_pandas(), and .from_pyspark() methods because their data gets populated
dynamically based on the series indicated in their
.linked_to
property.
from highcharts_gantt.options.series.area import LineSeries
from highcharts_gantt.options.series.data.cartesian import CartesianData
from highcharts_gantt.options.series.data.cartesian import CartesianDataCollection

# Creating CartesianData instances from an array

# EXAMPLE 1
# A simple array of numerical values which correspond to the Y value of the data
# point

my_data = CartesianData.from_array([0, 5, 3, 5])

# EXAMPLE 2
# An array containing 2-member arrays (corresponding to the X and Y values of the
# data point)

my_data = CartesianData.from_array([
    [0, 0],
    [1, 5],
    [2, 3],
    [3, 5]
])

# EXAMPLE 3
# An array of dict with named values

my_data = CartesianData.from_array([
  {
      'x': 0,
      'y': 0,
      'name': 'Point1',
      'color': '#00FF00'
  },
  {
      'x': 1,
      'y': 5,
      'name': 'Point2',
      'color': '#CCC'
  },
  {
      'x': 2,
      'y': 3,
      'name': 'Point3',
      'color': '#999'
  },
  {
      'x': 3,
      'y': 5,
      'name': 'Point4',
      'color': '#000'
  }
])

# EXAMPLE 5
# using a NumPy ndarray named "numpy_array"

my_data = CartesianData.from_array(numpy_array)


my_series = LineSeries(data = my_data)

# Creating a CartesianDataCollection instance from an array

# EXAMPLE 1
# A simple array of numerical values which correspond to the Y value of the data
# point

my_data = CartesianDataCollection.from_array([0, 5, 3, 5])

# EXAMPLE 2
# An array containing 2-member arrays (corresponding to the X and Y values of the
# data point)

my_data = CartesianDataCollection.from_array([
    [0, 0],
    [1, 5],
    [2, 3],
    [3, 5]
])

# EXAMPLE 3
# An array of dict with named values

my_data = CartesianDataCollection.from_array([
  {
      'x': 0,
      'y': 0,
      'name': 'Point1',
      'color': '#00FF00'
  },
  {
      'x': 1,
      'y': 5,
      'name': 'Point2',
      'color': '#CCC'
  },
  {
      'x': 2,
      'y': 3,
      'name': 'Point3',
      'color': '#999'
  },
  {
      'x': 3,
      'y': 5,
      'name': 'Point4',
      'color': '#000'
  }
])

# EXAMPLE 5
# using a NumPy ndarray named "numpy_array"

my_data = CartesianDataCollection.from_array(numpy_array)

my_series = LineSeries(data = my_data)

# Creating CartesianData instances from an array

# EXAMPLE 1
# A simple array of numerical values which correspond to the Y value of the data
# point

my_series = LineSeries.from_array([0, 5, 3, 5])

# EXAMPLE 2
# An array containing 2-member arrays (corresponding to the X and Y values of the
# data point)

my_series = LineSeries.from_array([
    [0, 0],
    [1, 5],
    [2, 3],
    [3, 5]
])

# EXAMPLE 3
# An array of dict with named values

my_series = LineSeries.from_array([
  {
      'x': 0,
      'y': 0,
      'name': 'Point1',
      'color': '#00FF00'
  },
  {
      'x': 1,
      'y': 5,
      'name': 'Point2',
      'color': '#CCC'
  },
  {
      'x': 2,
      'y': 3,
      'name': 'Point3',
      'color': '#999'
  },
  {
      'x': 3,
      'y': 5,
      'name': 'Point4',
      'color': '#000'
  }
])

# EXAMPLE 5
# using a NumPy ndarray named "numpy_array"

my_series = LineSeries.from_array(numpy_array)
Method Signature
See also
Chart.from_array()
- classmethod from_array(cls, value)
Creates a collection of data point instances, parsing the contents of
valueas an array (iterable). This method is specifically used to parse data that is input to Highcharts for Python without property names, in an array-organized structure as described in the Highcharts JS documentation.See also
The specific structure of the expected array is highly dependent on the type of data point that the series needs, which itself is dependent on the series type itself.
Please review the detailed series documentation for series type-specific details of relevant array structures.
- Parameters:
value (iterable) –
The value that should contain the data which will be converted into data point instances.
Note
If
valueis not an iterable, it will be converted into an iterable to be further de-serialized correctly.- Returns:
Collection of data point instances (descended from
DataBase)- Return type:
:class:`list <python:list> of
DataBase-descendant instances, orDataPointCollection
Note
The
.from_asana()method is available on theChartandGanttSeriesclasses, allowing you to either assemble a series or an entire chart from an Asana project with only one method call.
from highcharts_gantt.chart import Chart
from highcharts_gantt.options.series.gantt import GanttSeries

# Create a new GanttSeries instance from an Asana project with ID 123456
# - note that this method will automatically read your Asana Personal Access Token from
#   the ASANA_PERSONAL_ACCESS_TOKEN environment variable. You can also supply it
#   directly using the "personal_access_token" keyword argument.
my_series = GanttSeries.from_asana(project_gid = '123456')

# Create a new Chart instance from an Asana project with ID 123456
# - note that this method will automatically read your Asana Personal Access Token from
#   the ASANA_PERSONAL_ACCESS_TOKEN environment variable. You can also supply it
#   directly using the "personal_access_token" keyword argument.
my_chart = Chart.from_asana(project_gid = '123456')
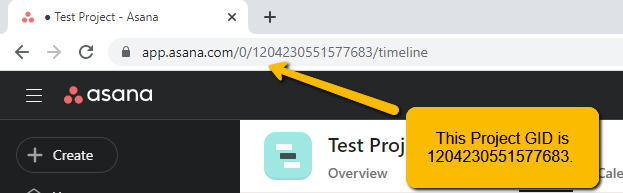
Tip
Where to find my Asana Project GID?
Of course, you can find your Asana Project GID using the Asana API, but that is typically a bit cumbersome. The easiest way to find it is to simply grab it out of your browser’s URL bar:

Method Signature
See also
GanttData.from_asana()
- classmethod .from_asana(cls, project_gid, section_gid=None, completed_since=None, use_html_description=True, personal_access_token=None, asana_client=None, api_request_params=None, connection_kwargs=None, connection_callback=None, series_kwargs=None)
Create a
GanttSeriesinstance from an Asana project.Note
Highcharts Gantt for Python can create an Asana API client for you, authenticating using the Personal Access Token method supported by the Asana API. However, if you wish to use the more-involved OAuth2 handshake process you will need to create your own Asana API client using the asana-python library.
The reason for this is because the OAuth2 handshake has various permutations involving redirects, token refreshes, etc. which are outside the scope of the Highcharts Gantt for Python library, and if you are integrating Highcharts Gantt for Python into a larger application you are likely already facilitating the OAuth2 dance in a fashion appropriate for your use case.
- Parameters:
project_gid (
str) –The globally unique ID of the Project whose tasks should be used to assemble the Gantt chart.
Tip
You can find your Asana Project GID in your browser URL bar:
section_gid (
strorNone) – The optional unique ID of the section whose tasks should be used to assemble the Gantt chart. Defaults toNone, which returns all tasks in the project.completed_since (
datetimeorNone) – An optional filter which only returns tasks that have been completed after this date. Defaults toNone, which returns all tasks.use_html_description (
bool) – IfTrue, will use the Asana task’s HTML notes in the data point’s.descriptionfield. IfFalse, will use the non-HTML notes. Defaults toTrue.personal_access_token (
strorNone) – A Personal Access Token created by Asana. Defaults toNone, which tries to determine its value by looking in theASANA_PERSONAL_ACCESS_TOKENenvironment variable.api_request_params (
dictorNone) – Collection of additional request parameters to submit to the Asana API. Defaults toNone.connection_kwargs (
dictorNone) – Set of keyword arugments to supply to theDataConnectionconstructor, besides the.toproperty which is derived from the task. Defaults toNoneconnection_callback (Callable or
None) –A custom Python function or method which accepts two keyword arguments:
connection_target(which expects the dependencydictobject from the Asana task), andasana_task(which expects the Asana taskdictobject). The function should return aDataConnectioninstance. Defaults toNoneTip
The
connection_callbackargument is useful if you want to customize the connection styling based on properties included in the Asana task.series_kwargs (
dictorNone) – Collection of additional keyword arguments to use when instantiating theGanttSeries(besides thedataargument, which will be determined from the Asana tasks). Defaults toNone.
- Returns:
A
GanttSeriespopulated with data from the indicated Asana project/section.- Return type:
- Raises:
HighchartsDependencyError – if the asana Python library is not available in the runtime environment.
HighchartsValueError – if
connection_callbackis notNone, but is not callableHighchartsValueError – if
asana_clientis notNone, but is not a validasana.client.Client>instanceAsanaAuthenticationError – if
asana_clientis not authenticated or if no personal access token is supplied
Note
The
.from_monday()method is available on theChartandGanttSeriesclasses, allowing you to either assemble a series or an entire chart from a Monday.com work board with only one method call.
from highcharts_gantt.chart import Chart
from highcharts_gantt.options.series.gantt import GanttSeries

# Create a new GanttSeries instance from a Monday.com board with ID 123456
# - note that this method will automatically read your Monday.com API Token from
#   the MONDAY_API_TOKEN environment variable. You can also supply it
#   directly using the "api_token" keyword argument.
my_series = GanttSeries.from_monday(board_id = '123456')

# Create a new Chart instance from a Monday.com board ID 123456
# - note that this method will automatically read your Monday.com API Token from
#   the MONDAY_API_TOKEN environment variable. You can also supply it
#   directly using the "api_token" keyword argument.
my_chart = Chart.from_monday(board_id = '123456')
Tip
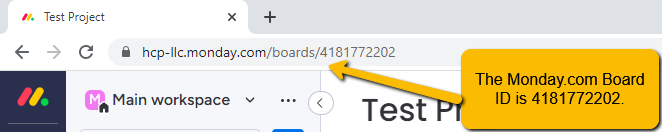
Where to find my Monday.com Board ID?
Of course, you can find your Monday.com Board ID using the Monday.com API, but that is typically a bit cumbersome. The easiest way to find it is to simply grab it out of your browser’s URL bar:

Method Signature
See also
GanttData.from_monday()
- classmethod .from_monday(cls, board_id, api_token=None, template=None, property_column_map=None, connection_kwargs=None, connection_callback=None, series_kwargs=None)
Create a
GanttSeriesinstance from a Monday.com work board.- Parameters:
board_id (
int) –The ID of the Monday.com board whose items should be retrieved to populate the Gantt series.
Tip
You can find your Asana Project GID in your browser URL bar:
The Monday.com API token to use when authenticating your request against the Monday.com API. Defaults to
None, which will then try to determine the token from theMONDAY_API_TOKENenvironment variable.Warning
If no token is either passed to the method or found in the
MONDAY_API_TOKENenvironment variable, calling this method will raise an error.The name of a standard Mpnday.com board template supported by Highcharts for Python. If supplied, will override the
property_column_mapargument. Defaults toNone.Note
If
property_column_mapis set, thetemplateargument will be ignored and overridden byproperty_column_map.property_column_map (
dictorNone) –A
dictused to map Monday.com columns to their correspondingGanttSeriesproperties. Keys are expected to beGanttSeriesproperties, while values are expected to be Monday.com column field names. Defaults toNone.Note
If
property_column_mapis supplied, its settings override thetemplatesetting.connection_kwargs (
dictorNone) – Set of keyword arugments to supply to theDataConnectionconstructor, besides the.toproperty which is derived from the task. Defaults toNoneconnection_callback (Callable or
None) –A custom Python function or method which accepts two keyword arguments:
connection_target(which expects the dependencydictobject from the Asana task), andasana_task(which expects the Asana taskdictobject). The function should return aDataConnectioninstance. Defaults toNoneTip
The
connection_callbackargument is useful if you want to customize the connection styling based on properties included in the Asana task.series_kwargs (
dictorNone) – Collection of additional keyword arguments to use when instantiating theGanttSeries(besides thedataargument, which will be determined from the Asana tasks). Defaults toNone.
- Returns:
A
GanttSeriespopulated with data from the indicated Asana project/section.- Return type:
- Raises:
HighchartsDependencyError – if the monday Python library is not available in the runtime environment
MondayAuthenticationError – if there is no Monday.com API token supplied
HighchartsValueError – if both
templateandproperty_column_mapare empty
Note
The
.from_jira()method is available on theChartandGanttSeriesclasses, allowing you to either assemble a series or an entire chart from an Atlassian JIRA project using only one method call.
from highcharts_gantt.chart import Chart
from highcharts_gantt.options.series.gantt import GanttSeries

# Create a new GanttSeries instance from a JIRA project with key ABCD
# - note that this method will automatically read your JIRA authentication credentials
#   from HIGHCHARTS_JIRA_SERVER, HIGHCHARTS_JIRA_USERNAME, and HIGHCHARTS_JIRA_TOKEN
#   environment variables. You can also supply these parameters in keyword arguments
#   to the method call if you want.
my_series = GanttSeries.from_jira(project_key = 'ABCD')

# Create a new Chart instance from a Monday.com board ID 123456
# - note that this method will automatically read your JIRA authentication credentials
#   from HIGHCHARTS_JIRA_SERVER, HIGHCHARTS_JIRA_USERNAME, and HIGHCHARTS_JIRA_TOKEN
#   environment variables. You can also supply these parameters in keyword arguments
#   to the method call if you want.
my_chart = Chart.from_monday(project_key = 'ABCD')
Method Signature
See also
GanttData.from_jira()
- classmethod .from_jira(cls, project_key, server=None, jql=None, username=None, password_or_token=None, oauth_dict=None, client_kwargs=None, jira_client=None, connection_kwargs=None, connection_callback=None, series_kwargs=None)
Create a
GanttSeriesinstance from an Atlassian JIRA project.Note
Highcharts Gantt for Python can create a JIRA API client for you, authenticating using either the Basic Authentication or Access Token methods supported by the JIRA API. However, if you wish to use the more-involved OAuth2 handshake, you can do so yourself and either
- supply an
oauth_dictargument containing the OAuth2 configuration details, or
- supply an
supply a fully-authenticated
jira_client
The reason for this is because the OAuth2 handshake has various permutations involving redirects, token refreshes, etc. which are outside the scope of the Highcharts Gantt for Python library, and if you are integrating Highcharts Gantt for Python into a larger application you are likely already facilitating the OAuth2 dance in a fashion appropriate for your use case.
- Parameters:
project_key (
str) – The globally unique key of the Project whose tasks should be used to assemble the Gantt chart. For example,JRA.The URL of the JIRA instance from which data should be retrieved. Defaults to
None, which looks for a value in theHIGHCHARTS_JIRA_SERVERenvironment variable. If no value is found there, will then fallback to JIRA Cloud:'https://jira.atlasian.com'.Note
This argument will override the comparable setting in
client_kwargsifclient_kwargsis supplied.jql (
strorNone) – An optional JIRA Query Language query string to further narrow the issues returned from JIRA. Defaults toNone.The username to use when authenticating using either
basicortokenauthentication. Defaults toNone, which looks for a value in theHIGHCHARTS_JIRA_USERNAMEenvironment variable.Note
If
oauth2_dictis supplied, theusernameargument will be ignored since OAuth2 authentication will be used.password_or_token (
strorNone) –The password or access token to use when authenticating using either
basicortokenauthentication. Defaults toNone, which looks for a vlaue in theHIGHCHARTS_JIRA_TOKENenvironment variable.Note
If
oauth_dictis supplied, thepassword_or_tokenwill be ignored since OAuth2 authentication will be used.A
dictof key/value pairs providing configuration of the Oauth2 authentication details. Expected keys are:'access_token''access_token_secret''consumer_key''key_cert'
Defaults to
None.Note
To use OAuth2 authentication, an
oauth_dictmust be supplied. If you wish to force either basic or token authentication, make sure this argument remainsNone.client_kwargs (
dictorNone) – An optionaldictproviding keyword arguments to use when instantiating the JIRA client.jira_client (
jira.client.JIRAinstance that has been fully authenticated) – A fully-configured and fully-authenticated JIRA API client. Defaults toNone.connection_kwargs (
dictorNone) – Set of keyword arugments to supply to theDataConnectionconstructor, besides the.toproperty which is derived from the task. Defaults toNoneconnection_callback (Callable or
None) –A custom Python function or method which accepts two keyword arguments:
connection_target(which expects the dependencyIssueobject from the initialIssue), andissue(which expects the initialIssueobject). The function should return aDataConnectioninstance. Defaults toNone.Tip
The
connection_callbackargument is useful if you want to customize the connection styling based on properties included in the target issue.series_kwargs (
dictorNone) – Collection of additional keyword arguments to use when instantiating theGanttSeries(besides thedataargument, which will be determined from the JIRA issues). Defaults toNone.
- Returns:
A
GanttSeriespopulated with data from the indicated JIRA project.- Return type:
- Raises:
HighchartsDependencyError – if the jira Python library is not available in the runtime environment.
JIRAAuthenticationError – if no authentication details are provided or if the authentication process fails
JIRAProjectNotFoundError –
if the
project_keyis not found in the JIRAserverindicatedTip
This can happen if authentication fails silently, which can happen when using the JIRA Cloud environment.
HighchartsValueError – if other keyword arguments are misconfigured
from highcharts_gantt.chart import Chart
from highcharts_gantt.options.series.area import LineSeries

# Create one or more LineSeries instances from the CSV file "some-csv-file.csv".

# EXAMPLE 1. The minimum code to produce one series for each
# column in the CSV file (excluding the first column):

my_series = LineSeries.from_csv('some-csv-file.csv')

# EXAMPLE 2. Produces ONE series with more precise configuration:

my_series = LineSeries.from_csv('some-csv-file.csv',
                                property_column_map = {
                                    'x': 0,
                                    'y': 3,
                                    'id': 'id'
                                })

# EXAMPLE 3. Produces THREE series instances with
# more precise configuration:

my_series = LineSeries.from_csv('some-csv-file.csv',
                                property_column_map = {
                                    'x': 0,
                                    'y': [3, 5, 8],
                                    'id': 'id'
                                })

# Create a chart with one or more LineSeries instances from
# the CSV file "some-csv-file.csv".

# EXAMPLE 1: The minimum code:

my_chart = Chart.from_csv('some-csv-file.csv', series_type = 'line')

# EXAMPLE 2: For more precise configuration and *one* series:

my_chart = Chart.from_csv('some-csv-file.csv',
                          property_column_map = {
                              'x': 0,
                              'y': 3,
                              'id': 'id'
                          },
                          series_type = 'line')

# EXAMPLE 3: For more precise configuration and *multiple* series:

my_chart = Chart.from_csv('some-csv-file.csv',
                          property_column_map = {
                              'x': 0,
                              'y': [3, 5, 8],
                              'id': 'id'
                          },
                          series_type = 'line')
Method Signature
- classmethod .from_csv(cls, as_string_or_file, property_column_map=None, series_kwargs=None, has_header_row=True, delimiter=',', null_text='None', wrapper_character="'", line_terminator='\r\n', wrap_all_strings=False, double_wrapper_character_when_nested=False, escape_character='\\', series_in_rows=False, series_index=None, **kwargs)
Create one or more series instances with
.datapopulated from data in a CSV string or file.Note
To produce one or more
LineSeriesinstances, the minimum code required would be:# EXAMPLE 1. The minimum code: my_series = LineSeries.from_csv('some-csv-file.csv') # EXAMPLE 2. For more precise configuration and ONE series: my_series = LineSeries.from_csv('some-csv-file.csv', property_column_map = { 'x': 0, 'y': 3, 'id': 'id' }) # EXAMPLE 3. For more precise configuration and MULTIPLE series: my_series = LineSeries.from_csv('some-csv-file.csv', property_column_map = { 'x': 0, 'y': [3, 5, 8], 'id': 'id' })
As the example above shows, data is loaded into the
my_seriesinstance from the CSV file with a filenamesome-csv-file.csv.In EXAMPLE 1, the method will return one or more series where each series will default to having its
.xvalues taken from the first (index 0) column in the CSV, and oneLineSeriesinstance will be created for each subsequent column (which will populate that series’.yvalues.In EXAMPLE 2, the chart will contain one series, where the
.xvalues for each data point will be taken from the first (index 0) column in the CSV file. The.yvalues will be taken from the fourth (index 3) column in the CSV file. And the.idvalues will be taken from a column whose header row is labeled'id'(regardless of its index).In EXAMPLE 3, the chart will contain three series, all of which will have
.xvalues taken from the first (index 0) column,.idvalues from the column whose header row is labeled'id', and whose.ywill be taken from the fourth (index 3) column for the first series, the sixth (index 5) column for the second series, and the ninth (index 8) column for the third series.- Parameters:
as_string_or_file (
stror Path-like) –The CSV data to use to pouplate data. Accepts either the raw CSV data as a
stror a path to a file in the runtime environment that contains the CSV data.Tip
Unwrapped empty column values are automatically interpreted as null (
None).property_column_map (
dict) –A
dictused to indicate which data point property should be set to which CSV column. The keys in thedictshould correspond to properties in the data point class, while the value can either be a numerical index (starting with 0) or astrindicating the label for the CSV column.Note
If any of the values in
property_column_mapcontain an iterable, then one series will be produced for each item in the iterable. For example, the following:{ 'x': 0, 'y': [3, 5, 8] }
will return three series, each of which will have its
.xvalue populated from the first column (index 0), and whose.yvalues will be populated from the fourth, sixth, and ninth columns (indices 3, 5, and 8), respectively.series_type (
str) –Indicates the series type that should be created from the CSV data. Defaults to
'line'.Warning
This argument is not supported when calling
.from_csv()on a series instance. It is only supported when callingChart.from_csv().has_header_row (
bool) – IfTrue, indicates that the first row ofas_string_or_filecontains column labels, rather than actual data. Defaults toTrue.series_kwargs (
dict) –An optional
dictcontaining keyword arguments that should be used when instantiating the series instance. Defaults toNone.Warning
If
series_kwargscontains adatakey, its value will be overwritten. Thedatavalue will be created from the CSV file instead.delimiter (
str) – The delimiter used between columns. Defaults to,.wrapper_character (
str) – The string used to wrap string values when wrapping is applied. Defaults to'.null_text (
str) – The string used to indicate an empty value if empty values are wrapped. Defaults to None.line_terminator (
str) – The string used to indicate the end of a line/record in the CSV data. Defaults to'\r\n'.line_terminator –
The string used to indicate the end of a line/record in the CSV data. Defaults to
'\r\n'.Note
The Python
csvcurrently ignores theline_terminatorparameter and always applies'\r\n', by design. The Python docs say this may change in the future, so for future backwards compatibility we are including it here.wrap_all_strings (
bool) –If
True, indicates that the CSV file has all string data values wrapped in quotation marks. Defaults toFalse.double_wrapper_character_when_nested (
bool) – IfTrue, quote character is doubled when appearing within a string value. IfFalse, theescape_characteris used to prefix quotation marks. Defaults toFalse.escape_character (
str) – A one-character string that indicates the character used to escape quotation marks if they appear within a string value that is already wrapped in quotation marks. Defaults to\\(which is Python for'\', which is Python’s native escape character).series_in_rows (
bool) – ifTrue, will attempt a streamlined cartesian series with x-values taken from column names, y-values taken from row values, and the series name taken from the row index. Defaults toFalse.series_index (
int, slice, orNone) – ifNone, will attempt to populate the chart with multiple series from the CSV data. If anintis supplied, will populate the chart only with the series found atseries_index.**kwargs –
Remaining keyword arguments will be attempted on the resulting series instance and the data points it contains.
- Returns:
One or more series instances (descended from
SeriesBase) with its.dataproperty populated from the CSV data inas_string_or_file.- Return type:
listof series instances (descended fromSeriesBase) orSeriesBaseinstance- Raises:
HighchartsCSVDeserializationError – if
property_column_mapreferences CSV columns by their label, but the CSV data does not contain a header row
# Given a Pandas DataFrame instance named "df"
from highcharts_gantt.chart import Chart
from highcharts_gantt.options.series.area import LineSeries

# Creating a Series from the DataFrame

## EXAMPLE 1. Minimum code required. Creates one or more series.

my_series = LineSeries.from_pandas(df)

## EXAMPLE 2. More precise configuration. Creates ONE series.

my_series = LineSeries.from_pandas(df, series_index = 2)

## EXAMPLE 3. More precise configuration. Creates ONE series.

my_series = LineSeries.from_pandas(df,
                                   property_map = {
                                       'x': 'date',
                                       'y': 'value',
                                       'id': 'id'
                                   })

## EXAMPLE 4. More precise configuration. Creates THREE series.

my_series = LineSeries.from_pandas(df,
                                   property_map = {
                                       'x': 'date',
                                       'y': ['value1', 'value2', 'value3'],
                                       'id': 'id'
                                   })

## EXAMPLE 5. Minimum code required. Creates one or more series
## from a dataframe where each row in the dataframe is a
## Highcharts series. The two lines of code below are equivalent.

my_series = LineSeries.from_pandas_in_rows(df)

# Creating a Chart with a lineSeries from the DataFrame.

## EXAMPLE 1. Minimum code required. Populates the chart with
## one or more series.

my_chart = Chart.from_pandas(df)

## EXAMPLE 2. More precise configuration. Populates the chart with
## one series.

my_chart = Chart.from_pandas(df, series_index = 2)

## EXAMPLE 3. More precise configuration. Populates the chart with
## ONE series.

my_chart = Chart.from_pandas(df,
                             property_map = {
                                 'x': 'date',
                                 'y': 'value',
                                 'id': 'id'
                             },
                             series_type = 'line')

## EXAMPLE 4. More precise configuration. Populates the chart with
## THREE series.

my_chart = Chart.from_pandas(df,
                             property_map = {
                                 'x': 'date',
                                 'y': ['value1', 'value2', 'value3'],
                                 'id': 'id'
                             },
                             series_type = 'line')

## EXAMPLE 5. Minimum code required. Creates a Chart populated
## with series from a dataframe where each row in the dataframe
## becomes a series on the chart.

my_chart = Chart.from_pandas_in_rows(df)
Method Signature
- classmethod .from_pandas(cls, df, property_map=None, series_kwargs=None, series_in_rows=False, series_index=None, **kwargs)
Create one or more series instances whose
.dataproperties are populated from a pandasDataFrame.- Parameters:
df (
DataFrame) – TheDataFramefrom which data should be loaded.property_map (
dict) –An optional
dictused to indicate which data point property should be set to which column indf. The keys in thedictshould correspond to properties in the data point class, while the value should indicate the label for theDataFramecolumn.Note
If any of the values in
property_mapcontain an iterable, then one series will be produced for each item in the iterable. For example, the following:{ 'x': 'timestamp', 'y': ['value1', 'value2', 'value3'] }
will return three series, each of which will have its
.xvalue populated from the column labeled'timestamp', and whose.yvalues will be populated from the columns labeled'value1','value2', and'value3', respectively.series_type (
str) –Indicates the series type that should be created from the CSV data. Defaults to
'line'.Warning
This argument is not supported when calling
.from_pandas()on a series. It is only supported when callingChart.from_csv().series_kwargs (
dict) –An optional
dictcontaining keyword arguments that should be used when instantiating the series instance. Defaults toNone.Warning
If
series_kwargscontains adatakey, its value will be overwritten. Thedatavalue will be created fromdfinstead.series_in_rows (
bool) – ifTrue, will attempt a streamlined cartesian series with x-values taken from column names, y-values taken from row values, and the series name taken from the row index. Defaults toFalse.False.series_index (
int, slice, orNone) – If supplied, return the series that Highcharts for Python generated fromdfat theseries_indexvalue. Defaults toNone, which returns all series generated fromdf.**kwargs –
Remaining keyword arguments will be attempted on the resulting series instance and the data points it contains.
- Returns:
One or more series instances (descended from
SeriesBase) with the.dataproperty populated from the data indf.- Return type:
listof series instances (descended fromSeriesBase), or aSeriesBase-descended instance- Raises:
HighchartsPandasDeserializationError – if
property_mapreferences a column that does not exist in the data frameHighchartsDependencyError – if pandas is not available in the runtime environment
# Given a PySpark DataFrame instance named "df"

from highcharts_gantt.chart import Chart
from highcharts_gantt.options.series.area import LineSeries

# Create a LineSeries from the PySpark DataFrame "df"
my_series = LineSeries.from_pyspark(df,
                                    property_map = {
                                        'x': 'date',
                                        'y': 'value',
                                        'id': 'id'
                                    })

# Create a new Chart witha LineSeries from the DataFrame "df"
my_chart = Chart.from_pyspark(df,
                              property_map = {
                                  'x': 'date',
                                  'y': 'value',
                                  'id': 'id'
                              },
                              series_type = 'line')
Method Signature
See also
- classmethod .from_pyspark(cls, df, property_map, series_kwargs=None)
Create a series instance whose
.dataproperty is populated from a PySparkDataFrame.- Parameters:
df (
DataFrame) – TheDataFramefrom which data should be loaded.property_map (
dict) – Adictused to indicate which data point property should be set to which column indf. The keys in thedictshould correspond to properties in the data point class, while the value should indicate the label for theDataFramecolumn.series_kwargs (
dict) –An optional
dictcontaining keyword arguments that should be used when instantiating the series instance. Defaults toNone.Warning
If
series_kwargscontains adatakey, its value will be overwritten. Thedatavalue will be created fromdfinstead.
- Returns:
A series instance (descended from
SeriesBase) with its.dataproperty populated from the data indf.- Return type:
listof series instances (descended fromSeriesBase)- Raises:
HighchartsPySparkDeserializationError – if
property_mapreferences a column that does not exist in the data frameif PySpark is not available in the runtime environment
Adding Series to Charts
Now that you have constructed your series instances, you can add them to
charts very easily. First, Highcharts for Python represents visualizations as
instances of the Chart class. This class contains
an options property, which itself contains
an instance of
HighchartsGanttOptions.
Note
The
HighchartsGanttOptionsis a sub-class of the Highcharts for PythonHighchartsOptionsclass, and is fully backwards-compatible with it. This means that you can use them interchangeably when using Highcharts Gantt for Python, as theHighchartsGanttOptionsclass merely extends its parent with a number of methods and properties that are specifically supported by Highcharts Gantt.Note
This structure - where the chart object contains an options object - is a little nested for some tastes, but it is the structure which Highcharts (JS) has adopted and so for the sake of consistency the Highcharts for Python Toolkit uses it as well.
To be visualized on your chart, you will need to add your series instances to the
Chart.options.series
property. You can do this in several ways:
from highcharts_gantt.chart import Chart
from highcharts_gantt.options.series.area import LineSeries
from highcharts_gantt.options.series.bar import BarSeries

# Create a Chart instance called "my_chart" with an empty set of options
my_chart = Chart(options = {})

# Create a couple Series instances
my_series1 = LineSeries()
my_series2 = BarSeries()

# Populate the options series list with the series you created.
my_chart.options.series = [my_series1, my_series2]

# Make a new one, and append it.
my_series3 = LineSeries()
my_chart.options.series.append(my_series3)
Note
.add_series()is supported by theChart,HighchartsGanttOptions, andHighchartsStockOptionsclasses
my_chart = Chart()

my_series = LineSeries()
my_chart.add_series(my_series)
Method Signature
- .add_series(self, *series)
Adds
seriesto theChart.options.seriesproperty.- Parameters:
series (
SeriesBaseor coercable) – One or more series instances (descended fromSeriesBase) or an instance (e.g.dict,str, etc.) coercable to one
Note
.from_series()is supported by theChart,HighchartsGanttOptions, andHighchartsStockOptionsclasses
my_series1 = LineSeries()
my_series2 = BarSeries()

my_chart = Chart.from_series(my_series1, my_series2, options = None)
Method Signature
- .from_series(cls, *series, kwargs=None)
Creates a new
Chartinstance populated withseries.- Parameters:
series (
SeriesBaseor coercable) – One or more series instances (descended fromSeriesBase) or an instance (e.g.dict,str, etc.) coercable to onekwargs (
dict) –Other properties to use as keyword arguments for the instance to be created.
Warning
If
kwargssets theoptions.seriesproperty, that setting will be overridden by the contents ofseries.
- Returns:
A new
Chartinstance- Return type:
Using Technical Indicators
One of the most valuable aspects of Highcharts Stock - which Highcharts Gantt for Python includes - is the inclusion of over 40 technical indicators. These are additional analytical tools which can be overlaid on your visualization to provide insights into the data you are looking at.
For example, are you hoping to understand whether the trajectory of a stock price is about to change? Or do you want to determine whether a given asset has been under-or-over sold? Or maybe you want to plot a simple linear regression against your primary series? You can do all of these and more using the technical indicators provided by Highcharts Stock.
Technical indicators are series in their own right, and can be added to your
chart the same as you would add any other series. However, unlike traditional series they
do not have a .data property, since they do not receive any data points. Instead,
they reference the primary series whose data should be used to calculate the indicator via
their .linked_to
property.
You can add a series using the following methods:
Note
All standard series (descending from
SeriesBase) have an
.add_indicator() method
which can be used to easily configure a new indicator tied to the series in
question.
# Given a series instance in the variable "my_series"

# Create a Chart instance
my_chart = Chart.from_series(my_series)

# Adds a new Simple Moving Average indicator to the chart, based off of the
# "my_series" series.

my_chart = my_series.add_indicator(my_chart, indicator_name = 'sma')
Method Signature
- .add_indicator(chart, indicator_name, indicator_kwargs=None)
- Parameters:
chart (
Chart) – The chart object in which the series is rendered and to which the indicator should be appended.indicator_name (
str) – The name of the indicator that should be added to the series and chart. For the list of supported indicators, please review the Indicator List.indicator_kwargs (
dictorNone) – Keyword arguments to apply when instantiating the new indicator series. Defaults toNone.
- Returns:
chartwith a new indicator series included in its list of configured series.- Return type:
# Given a series instance with ID "my-series-id" in the variable "my_series"

# Create a Chart instance from the series "my_series"
my_chart = Chart.from_series(my_series)

# Add a Simple Moving Average indicator to the series with the ID "my-series-id"
my_chart.add_indicator(indicator_name = 'sma',
                       series = 'my-series-id')

# Create a new Chart instance
my_chart2 = Chart(options = {})

# Add a Simple Moving Average indicator AND the series with the ID "my-series-id"
# to the chart in "my_chart2"
my_chart2.add_indicator(indicator_name = 'sma',
                        series = my_series)
Method Signature
- .add_indicator(indicator_name, series, indicator_kwargs=None)
Creates a
IndicatorSeriesBase(descendant) that calculates theindicator_nametechnical indicator for the series provided inseries, and adds it to the chart’s.options.series.- Parameters:
indicator_name (
str) – The name of the indicator that should be added to the series and chart. For the list of supported indicators, please review the Indicator List.series (
strorSeriesBase) – The series to which the indicator should be added. Accepts either a series’.idas astr, or aSeriesBase(descendant) instance.indicator_kwargs (
dictorNone) – Keyword arguments to apply when instantiating the new indicator series. Defaults toNone.
- Returns:
Nothing. It simply changes the composition of the chart instance’s series to now include a new series with the indicator.
Rendering Your Visualizations
Once you have created your Chart instance or
instances, you can render them very easily. There are really only two ways to display
your visualizations:
Rendering Highcharts Visualizations in Web Content
Highcharts is a suite of JavaScript libraries designed to enable rendering high-end data visualizations in a web context. They are designed and optimized to operate within a web browser. The Highcharts for Python Toolkit therefore fully supports this capability, and we’ve enabled it using the batteries included principle.
To render a Highcharts for Python visualization in a web context, all you need is
for the browser to execute the output of the chart’s
.to_js_literal() method.
That method will return a snippet of JavaScript code which when included in a web page will display the chart in full.
Warning
The .to_js_literal() method
assumes that your web content already has all the <script/> tags which include
the Highcharts (JS) modules your chart relies on.
If you need to generate the required <script/> tags for your chart, you can do
so by calling:
# EXAMPLE 1.
# Get a list of <script/> tags.
list_of_script_tags = my_chart.get_script_tags()

# EXAMPLE 2.
# Get a string of <script/> tags.
script_tags_as_str = my_chart.get_script_tags(as_str = True)

# EXAMPLE 3.
# Get a list of the required Highcharts modules.
required_modules = my_chart.get_required_modules()
For example:
from highcharts_gantt.chart import Chart
from highcharts_gantt.options.series.gantt import GanttSeries

my_chart = Chart(container = 'target_div',
                 options = {
                     'series': [
                         GanttSeries(data = [
                             ...
                         ])
                     ]
                 },
                 variable_name = 'myChart',
                 is_gantt_chart = True)

as_js_literal = my_chart.to_js_literal()

# This will produce a string equivalent to:
#
# document.addEventListener('DOMContentLoaded', function() {
#   const myChart = Highcharts.ganttChart('target_div', {
#      series: {
#          type: 'gantt',
#          data: [
#            ...
#          ]
#      }
#   });
# });
from highcharts_gantt.chart import Chart
from highcharts_gantt.options.series.area import LineSeries

my_chart = Chart(data = [0, 5, 3, 5], series_type = 'line')

as_js_literal = my_chart.to_js_literal()

# This will produce a string equivalent to:
#
# document.addEventListener('DOMContentLoaded', function() {
#   const myChart = Highcharts.chart('target_div', {
#      series: {
#          type: 'line',
#          data: [0, 5, 3, 5]
#      }
#   });
# });
Now you can use whatever front-end framework you are using to insert that string into your
application’s HTML output (in an appropriate <script/> tag, of course).
Tip
The same principle applies to the use of
SharedGanttOptions.
It is recommended to place the JS literal form of your shared options before any of the charts that you will be visualizing.
Rendering Highcharts for Python in Jupyter Labs or Jupyter Notebooks
You can also render Highcharts Gantt for Python visualizations inside your
Jupyter notebook. This is as simple as executing a single
.display() call on your
Chart instance:
from highcharts_gantt.chart import Chart
from highcharts_gantt.options.series.gantt import GanttSeries
from highcharts_gantt.global_options.shared_options import SharedGanttOptions

my_chart = Chart(data = [0, 5, 3, 5], series_type = 'line')

# Now this will render the contents of "my_chart" in your Jupyter Notebook
my_chart.display()

# You can also supply shared options to display to make sure that they are applied:
my_shared_options = SharedGanttOptions()

# Now this will render the contents of "my_chart" in your Jupyter Notebook, but applying
# your shared options
my_chart.display(global_options = my_shared_options)
Method Signature
- display(self, global_options=None, container=None, retries=5, interval=1000)
Display the chart in Jupyter Labs or Jupyter Notebooks.
- Parameters:
global_options (
SharedOptionsorNone) – The shared options to use when rendering the chart. Defaults toNoneThe ID to apply to the HTML container when rendered in Jupyter Labs. Defaults to
None, which applies the.containerproperty if set, and'highcharts_target_div'if not set.Note
Highcharts for Python will append a 6-character random string to the value of
containerto ensure uniqueness of the chart’s container when rendering in a Jupyter Notebook/Labs context. TheChartinstance will retain the mapping between container and the random string so long as the instance exists, thus allowing you to easily update the rendered chart by calling the.display()method again.If you wish to create a new chart from the instance that does not update the existing chart, then you can do so by specifying a new
containervalue.retries (
int) – The number of times to retry rendering the chart. Used to avoid race conditions with the Highcharts script. Defaults to 5.interval (
int) – The number of milliseconds to wait between retrying rendering the chart. Defaults to 1000 (1 second).
- Raises:
HighchartsDependencyError – if ipython is not available in the runtime environment
You can call the .display() method from anywhere within any notebook cell, and it
will render the resulting chart in your notebook’s output. That’s it!
Caution
If IPython is not available in your runtime environment, calling
.display()will raise aHighchartsDependencyError.
Stock Chart vs Regular Chart
When using Highcharts Gantt for Python you have the choice to render your charts using either the Highcharts Gantt chart constructor, the Highcharts Stock constructor, or the standard Highcharts Core constructor.
The difference between these constructors relates to the features available in the chart. The Highcharts Gantt and Stock charts will be visualized including the navigator component, and can support time series scrollbars, even if the specific chart you are visualizing does not need or use them. A regular Highcharts Core chart cannot be displayed with either of these elements.
It is entirely your decision, but you should know that Highcharts Core does not support any of the technical indicators supported by Highcharts Stock, and also does not support candlestick, HLC, or OHLC series types.
However, Highcharts Gantt can visualize all of the series types offered by both Highcharts Core and Highcharts Stock.
When working with your Chart object, you can set
the .is_gantt_chart property to
True to force the chart to be rendered using the (JavaScript)
Highcharts.ganttChart() constructor.
If you wish to force the use of the (JavaScript) Highcharts.stockChart(), you can set
the .is_stock_chart property to
True to force the chart to be rendered using the (JavaScript)
Highcharts.stockChart() constructor.
If you wish to force the use of the (JavaScript) Highcharts.chart()
constructor, you can explicitly set
.is_gantt_chart and
:meth:`.is_stock_chart <highcharts_gantt.chart.Chart.is_stock_chart>`__ to False after
populating the chart’s .options property.
If you do not set this property explicitly, Highcharts Gantt for Python will make
a determination based on the contents of the
.options property. If that that property
is set to a
HighchartsGanttOptions
instance, the .is_gantt_chart
property will be set to True, unless explicitly overridden in your code.
Downloading Your Visualizations
Sometimes you are not looking to produce an interactive web-based visualization of your data, but instead are looking to produce a static image of your visualization that can be downloaded, emailed, or embedded in some other documents.
With Highcharts Gantt for Python, that’s as simple as executing the
Chart.download_chart() method.
When you have defined a Chart instance, you can
download a static version of that chart or persist it to a file in your runtime
environment. The actual file itself is produced using a
Highcharts Export Server.
from highcharts_gantt.chart import Chart

my_chart = Chart(data = [0, 5, 3, 5],
                 series_type = 'line')

# Download a PNG version of the chart in memory within your Python code.
my_png_image = my_chart.download_chart(format = 'png')

# Download a PNG version of the chart and save it the file "/images/my-chart-file.png"
my_png_image = my_chart.download_chart(
    format = 'png',
    filename = '/images/my-chart-file.png'
)
Method Signature
- .download_chart(self, filename=None, format='png', server_instance=None, scale=1, width=None, auth_user=None, auth_password=None, timeout=0.5, global_options=None, **kwargs)
Export a downloaded form of the chart using a Highcharts Export Server.
- Parameters:
filename (Path-like or
None) – The name of the file where the exported chart should (optionally) be persisted. Defaults toNone.server_instance (
ExportServerorNone) – Provide an already-configuredExportServerinstance to use to programmatically produce the exported chart. Defaults toNone, which causes Highcharts for Python to instantiate a newExportServerinstance with all applicable defaults.format (
str) –The format in which the exported chart should be returned. Defaults to
'png'.Accepts:
'png''jpeg''pdf''svg'
scale (numeric) –
The scale factor by which the exported chart image should be scaled. Defaults to
1.Tip
Use this setting to improve resolution when exporting PNG or JPEG images. For example, setting
scale = 2on a chart whose width is 600px will produce an image file with a width of 1200px.Warning
If
widthis explicitly set, this setting will be overridden.width (numeric or
None) –The width that the exported chart should have. Defaults to
None.Warning
If explicitly set, this setting will override
scale.auth_user (
strorNone) – The username to use to authenticate against the Export Server, using basic authentication. Defaults toNone.auth_password (
strorNone) – The password to use to authenticate against the Export Server (using basic authentication). Defaults toNone.timeout (numeric or
None) – The number of seconds to wait before issuing a timeout error. The timeout check is passed if bytes have been received on the socket in less than thetimeoutvalue. Defaults to0.5.global_options (
HighchartsStockOptions,HighchartsOptionsorNone) – The global options which will be passed to the (JavaScript)Highcharts.setOptions()method, and which will be applied to the exported chart. Defaults toNone.
Note
All other keyword arguments are as per the
ExportServerconstructor.
from highcharts_gantt.chart import Chart
from highcharts_gantt.options.series.gantt import GanttSeries
from highcharts_gantt.headless_export import ExportServer

custom_server = ExportServer(url = 'https://www.mydomain.dev/some_pathname_goes_here')

my_chart = Chart(data = [0, 5, 3, 5],
                 series_type = 'line')

# Download a PNG version of the chart in memory within your Python code.
my_png_image = my_chart.download_chart(format = 'png',
                                       server_instance = custom_server)

# Download a PNG version of the chart and save it the file "/images/my-chart-file.png"
my_png_image = my_chart.download_chart(
    format = 'png',
    filename = '/images/my-chart-file.png',
    server_instance = custom_server
)
Tip
Best practice!
If you are using a custom export server, it is strongly recommended that you
supply its configuration (e.g. the URL) via environment variables. For more information,
please see
headless_export.ExportServer.
Method Signature
- .download_chart(self, filename=None, format='png', server_instance=None, scale=1, width=None, auth_user=None, auth_password=None, timeout=0.5, global_options=None, **kwargs)
Export a downloaded form of the chart using a Highcharts Export Server.
- Parameters:
filename (Path-like or
None) – The name of the file where the exported chart should (optionally) be persisted. Defaults toNone.server_instance (
ExportServerorNone) – Provide an already-configuredExportServerinstance to use to programmatically produce the exported chart. Defaults toNone, which causes Highcharts for Python to instantiate a newExportServerinstance with all applicable defaults.format (
str) –The format in which the exported chart should be returned. Defaults to
'png'.Accepts:
'png''jpeg''pdf''svg'
scale (numeric) –
The scale factor by which the exported chart image should be scaled. Defaults to
1.Tip
Use this setting to improve resolution when exporting PNG or JPEG images. For example, setting
scale = 2on a chart whose width is 600px will produce an image file with a width of 1200px.Warning
If
widthis explicitly set, this setting will be overridden.width (numeric or
None) –The width that the exported chart should have. Defaults to
None.Warning
If explicitly set, this setting will override
scale.auth_user (
strorNone) – The username to use to authenticate against the Export Server, using basic authentication. Defaults toNone.auth_password (
strorNone) – The password to use to authenticate against the Export Server (using basic authentication). Defaults toNone.timeout (numeric or
None) – The number of seconds to wait before issuing a timeout error. The timeout check is passed if bytes have been received on the socket in less than thetimeoutvalue. Defaults to0.5.global_options (
HighchartsStockOptions,HighchartsOptionsorNone) – The global options which will be passed to the (JavaScript)Highcharts.setOptions()method, and which will be applied to the exported chart. Defaults toNone.
Note
All other keyword arguments are as per the
ExportServerconstructor.
Warning
As of Highcharts for Python v.1.1.0, the Highcharts Export Server does not yet fully
support all of the series types added in Highcharts (JS) v.11. Attempting to programmatically download
one of those new as-yet-unsupported visualizations will generate a
HighchartsUnsupportedExportError.