.base
class: NonIndicatorOptions
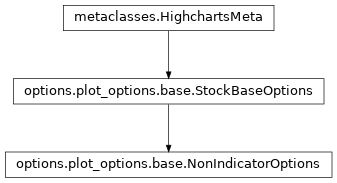
- class NonIndicatorOptions(**kwargs)[source]
Base class for Stock Plot Options, with navigator options.
Class Inheritance
- copy(other=None, overwrite=True, **kwargs)
Copy the configuration settings from this instance to the
otherinstance.- Parameters:
other (
HighchartsMeta) – The target instance to which the properties of this instance should be copied. IfNone, will create a new instance and populate it with properties copied fromself. Defaults toNone.overwrite (
bool) – ifTrue, properties inotherthat are already set will be overwritten by their counterparts inself. Defaults toTrue.kwargs – Additional keyword arguments. Some special descendents of
HighchartsMetamay have special implementations of this method which rely on additional keyword arguments.
- Returns:
A mutated version of
otherwith new property values
- classmethod from_dict(as_dict: dict, allow_snake_case: bool = True)
Construct an instance of the class from a
dictobject.
- classmethod from_js_literal(as_str_or_file, allow_snake_case: bool = True, _break_loop_on_failure: bool = False)
Return a Python object representation of a Highcharts JavaScript object literal.
- Parameters:
as_str_or_file (
str) – The JavaScript object literal, represented either as astror as a filename which contains the JS object literal.allow_snake_case (
bool) – IfTrue, interpretssnake_casekeys as equivalent tocamelCasekeys. Defaults toTrue._break_loop_on_failure (
bool) – IfTrue, will break any looping operations in the event of a failure. Otherwise, will attempt to repair the failure. Defaults toFalse.
- Returns:
A Python object representation of the Highcharts JavaScript object literal.
- Return type:
HighchartsMeta
- classmethod from_json(as_json_or_file, allow_snake_case: bool = True)
Construct an instance of the class from a JSON string.
- Parameters:
as_json_or_file – The JSON string for the object or the filename of a file that contains the JSON string.
allow_snake_case (
bool) – IfTrue, interpretssnake_casekeys as equivalent tocamelCasekeys. Defaults toTrue.
- Returns:
A Python objcet representation of
as_json.- Return type:
HighchartsMeta
- get_required_modules(include_extension=False) List[str]
Return the list of URLs from which the Highcharts JavaScript modules needed to render the chart can be retrieved.
- to_dict() dict
Generate a
dictrepresentation of the object compatible with the Highcharts JavaScript library.Note
The
dictrepresentation has a property structure and naming convention that is intentionally consistent with the Highcharts JavaScript library. This is not Pythonic, but it makes managing the interplay between the two languages much, much simpler.
- to_js_literal(filename=None, encoding='utf-8', careful_validation=False) str | None
Return the object represented as a
strcontaining the JavaScript object literal.- Parameters:
along the way using the esprima-python library. Defaults to
False.Warning
Setting this value to
Truewill significantly degrade serialization performance, though it may prove useful for debugging purposes.
- to_json(filename=None, encoding='utf-8')
Generate a JSON string/byte string representation of the object compatible with the Highcharts JavaScript library.
Note
This method will either return a standard
stror abytesobject depending on the JSON serialization library you are using. For example, if your environment has orjson, the result will be abytesrepresentation of the string.- Parameters:
- Returns:
A JSON representation of the object compatible with the Highcharts library.
- Return type:
- static trim_dict(untrimmed: dict, to_json: bool = False, context: str = None) dict
Remove keys from
untrimmedwhose values areNoneand convert values that have.to_dict()methods.- Parameters:
untrimmed (
dict) – Thedictwhose values may still beNoneor Python objects.to_json (
bool) – IfTrue, will remove all keys fromuntrimmedthat are not serializable to JSON. Defaults toFalse.context (
strorNone) – If provided, will inform the method of the context in which it is being run which may inform special handling cases (e.g. where empty strings may be important / allowable). Defaults toNone.
- Returns:
Trimmed
dict- Return type:
- static trim_iterable(untrimmed, to_json=False, context: str = None)
Convert any
EnforcedNullTypevalues inuntrimmedto'null'.- Parameters:
untrimmed (iterable) – The iterable whose members may still be
Noneor Python objects.to_json (
bool) – IfTrue, will remove all members fromuntrimmedthat are not serializable to JSON. Defaults toFalse.context (
strorNone) – If provided, will inform the method of the context in which it is being run which may inform special handling cases (e.g. where empty strings may be important / allowable). Defaults toNone.
- Return type:
iterable
- property compare: str | None
Determines whether to display the
'percent'or the'value'of the indicator’s comparison against the main series. Defaults toNone, which does not calculate the comparison.Accepts:
'percent'- returns the percentage calculation for the indicator'value'- returns the axis value calculation for the indicator
- property compare_base: int | None
When
.compareis set to'percent', this option determines whether to use0or100as the basis of comparison. Defaults to0.Accepts:
0100
- property compare_start: bool | None
If
True, the first point in the visible range will be used for the comparative calculation, essentially starting from0. IfFalse, the comparison will be performed based on the data point immediately prior to the visible range. Defaults toFalse.
- property cumulative: bool | None
If
True, replaces points’ values with the following (logcical) formula:sum of all previous visible points' values + current point's valueCaution
This calculation is only applied to points in the visible range.
If
False, the point values remain unchanged and are presented as-is. Defaults toFalse.Note
In JavaScript, each point object for the series will now have a new property -
.cumulativeSum- available for use in formatter callback functions or format strings.
- property data_as_columns: bool | None
If
True, indicates that the data is structured as columns instead of as rows. Defaults toFalse.
- property data_grouping: DataGroupingOptions | None
Data grouping configures sampling the data values into larger blocks in order to ease readability and increase performance of the JavaScript charts.
Highcharts Stock by default applies data grouping when the points become closer than the number of pixels specified by the
.group_pixel_widthsetting.Note
If data grouping is applied, the grouping information of grouped points can be read (in JavaScript) from
Point.dataGroup.Caution
If point options other than the data itself are set, for example
name,color, or custom properties, the grouping logic will not know how to group it. In this case, the options of the first point instance are copied over to the group point. This can be altered through a customapproximationfunction.
- property gap_size: int | float | Decimal | None
In combination with
.gap_unitdefines when to display a gap in the graph. Defaults to0.Note
If
.data_groupingis enabled, points can be grouped into a larger time span. This can make the grouped points have a greater distance than the absolute value of the.gap_sizeproperty, which would result in data disappearing from view completely. To prevent this situation, the mentioned distance between grouped points is applied rather than the explicitly supplied.gap_size.Tip
In practice, this option is most often used to visualize gaps in time series. In a stock chart, intraday data is available for daytime hours, while gaps will appear in nights and weekends.
- Return type:
numeric or
None
- property gap_unit: str | None
In combination with
.gap_sizedefines when to display a gap in the graph. Defaults to'relative'.Accepts two possible values:
'relative'- determines the gap based on a multiple of.gap_size. For example, with a.gap_sizeof5, if the distance between two points is greater than 5x the two closest points, a gap will be rendered.'value'- determines the gap based on the absolute axis values, which on a datetime axis are expressed in milliseconds.
- property last_price: LastPriceOptions | None
Configuration of a line marking the last price from all data points (whether visible or not). Defaults to
None.See also
.last_visible_price
- Return type:
- property last_visible_price: LastPriceOptions | None
Configuration of a line marking the last price from all visible data points. Defaults to
None.See also
.last_price
- Return type:
LastPriceOptionsorNone
Options for the corresponding navigator series if
.show_in_navigatorisTruefor this series. Defaults toNoneNote
These options are merged with options in
navigator.series, and will take precedence if the same option is defined both places.- Return type:
NavigatorOptionsorNone
- property point_range: EnforcedNullType | int | float | Decimal | None
The X axis range that each point is valid for, which determines the width of the column. Defaults to
EnforcedNull, which computes the range automatically.On a categorized axis, the range will be
1by default (one category unit). On linear and datetime axes, the range will be computed as the distance between the two closest data points.The default
EnforcedNullmeans it is computed automatically, but the setting can be used to override the default value.Note
If
data_sortingis enabled, the default value is implicitly adjusted to1.- Return type:
numeric or
EnforcedNullTypeorNone
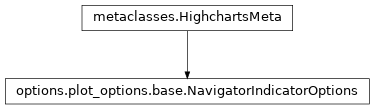
class: NavigatorIndicatorOptions
Set of options to mix in when an indicator supports a presence in the Navigator.
Class Inheritance
Copy the configuration settings from this instance to the
otherinstance.- Parameters:
other (
HighchartsMeta) – The target instance to which the properties of this instance should be copied. IfNone, will create a new instance and populate it with properties copied fromself. Defaults toNone.overwrite (
bool) – ifTrue, properties inotherthat are already set will be overwritten by their counterparts inself. Defaults toTrue.kwargs – Additional keyword arguments. Some special descendents of
HighchartsMetamay have special implementations of this method which rely on additional keyword arguments.
- Returns:
A mutated version of
otherwith new property values
Construct an instance of the class from a
dictobject.
Return a Python object representation of a Highcharts JavaScript object literal.
- Parameters:
as_str_or_file (
str) – The JavaScript object literal, represented either as astror as a filename which contains the JS object literal.allow_snake_case (
bool) – IfTrue, interpretssnake_casekeys as equivalent tocamelCasekeys. Defaults toTrue._break_loop_on_failure (
bool) – IfTrue, will break any looping operations in the event of a failure. Otherwise, will attempt to repair the failure. Defaults toFalse.
- Returns:
A Python object representation of the Highcharts JavaScript object literal.
- Return type:
HighchartsMeta
Construct an instance of the class from a JSON string.
- Parameters:
as_json_or_file – The JSON string for the object or the filename of a file that contains the JSON string.
allow_snake_case (
bool) – IfTrue, interpretssnake_casekeys as equivalent tocamelCasekeys. Defaults toTrue.
- Returns:
A Python objcet representation of
as_json.- Return type:
HighchartsMeta
Return the list of URLs from which the Highcharts JavaScript modules needed to render the chart can be retrieved.
Generate a
dictrepresentation of the object compatible with the Highcharts JavaScript library.Note
The
dictrepresentation has a property structure and naming convention that is intentionally consistent with the Highcharts JavaScript library. This is not Pythonic, but it makes managing the interplay between the two languages much, much simpler.
Return the object represented as a
strcontaining the JavaScript object literal.- Parameters:
along the way using the esprima-python library. Defaults to
False.Warning
Setting this value to
Truewill significantly degrade serialization performance, though it may prove useful for debugging purposes.
Generate a JSON string/byte string representation of the object compatible with the Highcharts JavaScript library.
Note
This method will either return a standard
stror abytesobject depending on the JSON serialization library you are using. For example, if your environment has orjson, the result will be abytesrepresentation of the string.- Parameters:
- Returns:
A JSON representation of the object compatible with the Highcharts library.
- Return type:
Remove keys from
untrimmedwhose values areNoneand convert values that have.to_dict()methods.- Parameters:
untrimmed (
dict) – Thedictwhose values may still beNoneor Python objects.to_json (
bool) – IfTrue, will remove all keys fromuntrimmedthat are not serializable to JSON. Defaults toFalse.context (
strorNone) – If provided, will inform the method of the context in which it is being run which may inform special handling cases (e.g. where empty strings may be important / allowable). Defaults toNone.
- Returns:
Trimmed
dict- Return type:
Convert any
EnforcedNullTypevalues inuntrimmedto'null'.- Parameters:
untrimmed (iterable) – The iterable whose members may still be
Noneor Python objects.to_json (
bool) – IfTrue, will remove all members fromuntrimmedthat are not serializable to JSON. Defaults toFalse.context (
strorNone) – If provided, will inform the method of the context in which it is being run which may inform special handling cases (e.g. where empty strings may be important / allowable). Defaults toNone.
- Return type:
iterable
class: StockBaseOptions
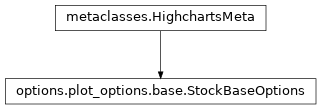
- class StockBaseOptions(**kwargs)[source]
Base class for Stock Plot Options.
Class Inheritance
- copy(other=None, overwrite=True, **kwargs)
Copy the configuration settings from this instance to the
otherinstance.- Parameters:
other (
HighchartsMeta) – The target instance to which the properties of this instance should be copied. IfNone, will create a new instance and populate it with properties copied fromself. Defaults toNone.overwrite (
bool) – ifTrue, properties inotherthat are already set will be overwritten by their counterparts inself. Defaults toTrue.kwargs – Additional keyword arguments. Some special descendents of
HighchartsMetamay have special implementations of this method which rely on additional keyword arguments.
- Returns:
A mutated version of
otherwith new property values
- classmethod from_dict(as_dict: dict, allow_snake_case: bool = True)
Construct an instance of the class from a
dictobject.
- classmethod from_js_literal(as_str_or_file, allow_snake_case: bool = True, _break_loop_on_failure: bool = False)
Return a Python object representation of a Highcharts JavaScript object literal.
- Parameters:
as_str_or_file (
str) – The JavaScript object literal, represented either as astror as a filename which contains the JS object literal.allow_snake_case (
bool) – IfTrue, interpretssnake_casekeys as equivalent tocamelCasekeys. Defaults toTrue._break_loop_on_failure (
bool) – IfTrue, will break any looping operations in the event of a failure. Otherwise, will attempt to repair the failure. Defaults toFalse.
- Returns:
A Python object representation of the Highcharts JavaScript object literal.
- Return type:
HighchartsMeta
- classmethod from_json(as_json_or_file, allow_snake_case: bool = True)
Construct an instance of the class from a JSON string.
- Parameters:
as_json_or_file – The JSON string for the object or the filename of a file that contains the JSON string.
allow_snake_case (
bool) – IfTrue, interpretssnake_casekeys as equivalent tocamelCasekeys. Defaults toTrue.
- Returns:
A Python objcet representation of
as_json.- Return type:
HighchartsMeta
- get_required_modules(include_extension=False) List[str]
Return the list of URLs from which the Highcharts JavaScript modules needed to render the chart can be retrieved.
- to_dict() dict
Generate a
dictrepresentation of the object compatible with the Highcharts JavaScript library.Note
The
dictrepresentation has a property structure and naming convention that is intentionally consistent with the Highcharts JavaScript library. This is not Pythonic, but it makes managing the interplay between the two languages much, much simpler.
- to_js_literal(filename=None, encoding='utf-8', careful_validation=False) str | None
Return the object represented as a
strcontaining the JavaScript object literal.- Parameters:
along the way using the esprima-python library. Defaults to
False.Warning
Setting this value to
Truewill significantly degrade serialization performance, though it may prove useful for debugging purposes.
- to_json(filename=None, encoding='utf-8')
Generate a JSON string/byte string representation of the object compatible with the Highcharts JavaScript library.
Note
This method will either return a standard
stror abytesobject depending on the JSON serialization library you are using. For example, if your environment has orjson, the result will be abytesrepresentation of the string.- Parameters:
- Returns:
A JSON representation of the object compatible with the Highcharts library.
- Return type:
- static trim_dict(untrimmed: dict, to_json: bool = False, context: str = None) dict
Remove keys from
untrimmedwhose values areNoneand convert values that have.to_dict()methods.- Parameters:
untrimmed (
dict) – Thedictwhose values may still beNoneor Python objects.to_json (
bool) – IfTrue, will remove all keys fromuntrimmedthat are not serializable to JSON. Defaults toFalse.context (
strorNone) – If provided, will inform the method of the context in which it is being run which may inform special handling cases (e.g. where empty strings may be important / allowable). Defaults toNone.
- Returns:
Trimmed
dict- Return type:
- static trim_iterable(untrimmed, to_json=False, context: str = None)
Convert any
EnforcedNullTypevalues inuntrimmedto'null'.- Parameters:
untrimmed (iterable) – The iterable whose members may still be
Noneor Python objects.to_json (
bool) – IfTrue, will remove all members fromuntrimmedthat are not serializable to JSON. Defaults toFalse.context (
strorNone) – If provided, will inform the method of the context in which it is being run which may inform special handling cases (e.g. where empty strings may be important / allowable). Defaults toNone.
- Return type:
iterable
- property compare_start: bool | None
If
True, the first point in the visible range will be used for the comparative calculation, essentially starting from0. IfFalse, the comparison will be performed based on the data point immediately prior to the visible range. Defaults toFalse.
- property cumulative: bool | None
If
True, replaces points’ values with the following (logcical) formula:sum of all previous visible points' values + current point's valueCaution
This calculation is only applied to points in the visible range.
If
False, the point values remain unchanged and are presented as-is. Defaults toFalse.Note
In JavaScript, each point object for the series will now have a new property -
.cumulativeSum- available for use in formatter callback functions or format strings.
- property data_as_columns: bool | None
If
True, indicates that the data is structured as columns instead of as rows. Defaults toFalse.
- property data_grouping: DataGroupingOptions | None
Data grouping configures sampling the data values into larger blocks in order to ease readability and increase performance of the JavaScript charts.
Highcharts Stock by default applies data grouping when the points become closer than the number of pixels specified by the
.group_pixel_widthsetting.Note
If data grouping is applied, the grouping information of grouped points can be read (in JavaScript) from
Point.dataGroup.Caution
If point options other than the data itself are set, for example
name,color, or custom properties, the grouping logic will not know how to group it. In this case, the options of the first point instance are copied over to the group point. This can be altered through a customapproximationfunction.
- property gap_size: int | float | Decimal | None
In combination with
.gap_unitdefines when to display a gap in the graph. Defaults to0.Note
If
.data_groupingis enabled, points can be grouped into a larger time span. This can make the grouped points have a greater distance than the absolute value of the.gap_sizeproperty, which would result in data disappearing from view completely. To prevent this situation, the mentioned distance between grouped points is applied rather than the explicitly supplied.gap_size.Tip
In practice, this option is most often used to visualize gaps in time series. In a stock chart, intraday data is available for daytime hours, while gaps will appear in nights and weekends.
- Return type:
numeric or
None
- property gap_unit: str | None
In combination with
.gap_sizedefines when to display a gap in the graph. Defaults to'relative'.Accepts two possible values:
'relative'- determines the gap based on a multiple of.gap_size. For example, with a.gap_sizeof5, if the distance between two points is greater than 5x the two closest points, a gap will be rendered.'value'- determines the gap based on the absolute axis values, which on a datetime axis are expressed in milliseconds.
- property last_price: LastPriceOptions | None
Configuration of a line marking the last price from all data points (whether visible or not). Defaults to
None.See also
.last_visible_price
- Return type:
- property last_visible_price: LastPriceOptions | None
Configuration of a line marking the last price from all visible data points. Defaults to
None.See also
.last_price
- Return type:
LastPriceOptionsorNone