.x_axis
class: XAxis
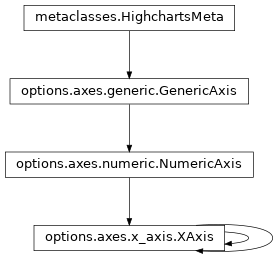
- class XAxis(**kwargs)[source]
Class Inheritance
- copy(other=None, overwrite=True, **kwargs)
Copy the configuration settings from this instance to the
otherinstance.- Parameters:
other (
HighchartsMeta) – The target instance to which the properties of this instance should be copied. IfNone, will create a new instance and populate it with properties copied fromself. Defaults toNone.overwrite (
bool) – ifTrue, properties inotherthat are already set will be overwritten by their counterparts inself. Defaults toTrue.kwargs – Additional keyword arguments. Some special descendents of
HighchartsMetamay have special implementations of this method which rely on additional keyword arguments.
- Returns:
A mutated version of
otherwith new property values
- classmethod from_dict(as_dict: dict, allow_snake_case: bool = True)
Construct an instance of the class from a
dictobject.
- classmethod from_js_literal(as_str_or_file, allow_snake_case: bool = True, _break_loop_on_failure: bool = False)
Return a Python object representation of a Highcharts JavaScript object literal.
- Parameters:
as_str_or_file (
str) – The JavaScript object literal, represented either as astror as a filename which contains the JS object literal.allow_snake_case (
bool) – IfTrue, interpretssnake_casekeys as equivalent tocamelCasekeys. Defaults toTrue._break_loop_on_failure (
bool) – IfTrue, will break any looping operations in the event of a failure. Otherwise, will attempt to repair the failure. Defaults toFalse.
- Returns:
A Python object representation of the Highcharts JavaScript object literal.
- Return type:
HighchartsMeta
- classmethod from_json(as_json_or_file, allow_snake_case: bool = True)
Construct an instance of the class from a JSON string.
- Parameters:
as_json_or_file – The JSON string for the object or the filename of a file that contains the JSON string.
allow_snake_case (
bool) – IfTrue, interpretssnake_casekeys as equivalent tocamelCasekeys. Defaults toTrue.
- Returns:
A Python objcet representation of
as_json.- Return type:
HighchartsMeta
- get_required_modules(include_extension=False) List[str]
Return the list of URLs from which the Highcharts JavaScript modules needed to render the chart can be retrieved.
- to_dict() dict
Generate a
dictrepresentation of the object compatible with the Highcharts JavaScript library.Note
The
dictrepresentation has a property structure and naming convention that is intentionally consistent with the Highcharts JavaScript library. This is not Pythonic, but it makes managing the interplay between the two languages much, much simpler.
- to_js_literal(filename=None, encoding='utf-8', careful_validation=False) str | None
Return the object represented as a
strcontaining the JavaScript object literal.- Parameters:
along the way using the esprima-python library. Defaults to
False.Warning
Setting this value to
Truewill significantly degrade serialization performance, though it may prove useful for debugging purposes.
- to_json(filename=None, encoding='utf-8')
Generate a JSON string/byte string representation of the object compatible with the Highcharts JavaScript library.
Note
This method will either return a standard
stror abytesobject depending on the JSON serialization library you are using. For example, if your environment has orjson, the result will be abytesrepresentation of the string.- Parameters:
- Returns:
A JSON representation of the object compatible with the Highcharts library.
- Return type:
- static trim_dict(untrimmed: dict, to_json: bool = False, context: str = None) dict
Remove keys from
untrimmedwhose values areNoneand convert values that have.to_dict()methods.- Parameters:
untrimmed (
dict) – Thedictwhose values may still beNoneor Python objects.to_json (
bool) – IfTrue, will remove all keys fromuntrimmedthat are not serializable to JSON. Defaults toFalse.context (
strorNone) – If provided, will inform the method of the context in which it is being run which may inform special handling cases (e.g. where empty strings may be important / allowable). Defaults toNone.
- Returns:
Trimmed
dict- Return type:
- static trim_iterable(untrimmed, to_json=False, context: str = None)
Convert any
EnforcedNullTypevalues inuntrimmedto'null'.- Parameters:
untrimmed (iterable) – The iterable whose members may still be
Noneor Python objects.to_json (
bool) – IfTrue, will remove all members fromuntrimmedthat are not serializable to JSON. Defaults toFalse.context (
strorNone) – If provided, will inform the method of the context in which it is being run which may inform special handling cases (e.g. where empty strings may be important / allowable). Defaults toNone.
- Return type:
iterable
- property accessibility: AxisAccessibility | None
Accessibility options for an axis object.
- Return type:
AxisAccessibilityorNone
- property align_ticks: bool | None
If
Trueand using multiple axes, the ticks of two or more opposite axes will automatically be aligned by adding ticks to the axis or axes with the least ticks, as iftick_amountwere specified. This can be prevented by settingalign_tickstoFalse.Defaults to
True.Hint
If the grid lines look messy, it’s a good idea to hide them for the secondary axis by setting
grid_line_widthto0.Warning
If
start_on_tickorend_on_tickin the axis options are set toFalse, then tick alignment will be disabled for the axis.Warning
Aways disabled for logarithmic axes.
- property allow_decimals: bool | None
If
True, allow decimals in the axis’ ticks. IfNone, decimals are allowed on small scale axes. Defaults toNone.Hint
When counting integers, like persons or hits on a web page, decimals should be avoided in the labels.
- property alternate_grid_color: str | Gradient | Pattern | None
When using an alternate grid color, a band is painted across the plot area between every other grid line. This setting determines the color of that band. Defaults to
None.
- property angle: int | float | Decimal | None
In a polar chart, this is the angle of the Y axis in degrees, where
0is up and90is right. Defaults to0.Note
The angle determines the position of the axis line and the labels, though the coordinate system is unaffected.
- Return type:
numeric or
None
- property breaks: List[AxisBreak] | None
A collection that defines breaks to render in the axis. Defaults to
None.Note
The sections defined as breaks will be left out and all the points shifted closer to each other.
- property categories: List[str] | None
If categories are present for the x-axis, displays category names along the x-axis instead of numerical values. Defaults to
None.Hint
While categories can also be defined by giving each data point a name and setting axis type to
'category', if you have multiple series, best practice remains using thecategoriessetting for ease of maintenance.
- property ceiling: int | float | Decimal | None
The highest allowed value for automatically computed axis extremes. Defaults to
None.- Return type:
numeric or
None
- property class_name: str | None
A class name that can then be used for styling the axis using CSS. Defaults to
None.Warning
The the
class_nameis applied to group elements for the grid, axis elements, and labels.
- property crosshair: CrosshairOptions | None
Configure a crosshair that follows either the mouse pointer or the hovered point. Defaults to
None.- Return type:
CrosshairOptionsorNone
- property crossing: int | float | Decimal | None
The value on a perpendicular axis where this axis should cross. Defaults to
None.Tip
This
is typically used on mathematical plots where the axes cross at
0.Warning
When
.crossingis set, space will not be reserved at the sides of the chart for axis labels and title, so those may be clipped. In this case, it is better to place the axes without the.crossingoption.- rtype:
numeric
- property current_date_indicator: PlotLine | None
Configuration for an indicator on the axis to provide the current date and time. Accepts either a
bool, or aPlotLineinstance.- Return type:
- property date_time_label_formats: DateTimeLabelFormats | None
For a datetime axis, the scale will automatically adjust to the appropriate unit. This setting gives the default string representations used for each unit. Defaults to
None.Note
For intermediate values, different units may be used, for example the day unit can be used on midnight and hour unit used for intermediate values on the same axis.
See also
DateTimeLabelFormats
- Return type:
DateTimeLabelFormatsorNone
- property end_on_tick: bool | None
If
Trueforces the axis to end on a tick. Defaults toFalseforXAxis,TrueforYAxis, andFalseforZAxis.Hint
Use this option with the
GenericAxis.max_padding()setting to control the axis end.Warning
This option is always disabled on a
YAxis, when panning type is eitheryorxy.
- property events: AxisEvents | None
Event handlers for the axis.
- Return type:
SeriesEventsorNone
- property floor: int | float | Decimal | None
The lowest allowed value for automatically computed axis extremes. Defaults to
None.- Return type:
numeric or
None
- property grid_line_color: str | Gradient | Pattern | None
Color of the grid lines extending the ticks across the plot area. Defaults to
'#e6e6e6'.
- property grid_line_dash_style: str | None
Name of the dash style to use for the grid lines. Defaults to
Solid.Accepts one of the following values:
‘Dash’,
‘DashDot’,
‘Dot’,
‘LongDash’,
‘LongDashDot’,
‘LongDashDotDot’,
‘ShortDash’,
‘ShortDashDot’,
‘ShortDashDotDot’,
‘ShortDot’,
‘Solid’
- property grid_line_interpolation: str | None
Whether the grid lines should draw as a polygon with straight lines between categories, or as circles. Defaults to
None.Acceptable values are:
'circle''polygon'
Warning
Only applies to polar charts.
- property grid_line_width: int | float | Decimal | None
The width of the grid lines extending the ticks across the plot area. Defaults to
0forXAxis,1forYAxis, andNoneforZAxis.- Return type:
numeric or
None
- property grid_z_index: int | float | Decimal | None
The Z-index of the grid lines. Defaults to
1.- Return type:
numeric or
None
- property height: int | float | Decimal | str | None
The height of the axis when operating as the vertical axis, expressed either in pixels or as a percentage of the total plot height. Defaults to
None.
- property id: str | None
An id assigned to the axis. Defaults to
None.Hint
This can be used after rendering to get a pointer to the axis object through the (JavaScript)
chart.get()method.
- property labels: AxisLabelOptions | None
Configuration settings for the axis labels, which show the number or category for each tick. Defaults to
None.- Return type:
AxisLabeLOptionsorNone
- property left: int | float | Decimal | str | None
The left position of the axis when operating as a horizontal axis, expresesd as the pixel position relative to the chart or a percentage of the plot width, offset from the plot area’s
leftposition. Defaults toNone.
- property line_color: str | Gradient | Pattern | None
The color of the line marking the axis itself. Defaults to
'#ccd6eb'.
- property line_width: int | float | Decimal | None
The width of the marking the axis itself, in pixels. Defaults to
1.- Return type:
numeric or
None
- property linked_to: int | None
The index of another axis that this axis is linked to.
When an axis is linked to a master axis, it will take the same extremes as the master as assigned by
NumericAxis.min()orNumericAxis.max()or by the (JavaScript)setExtremes()method. It can be used to show additional info, or to ease reading the chart by duplicating the scales.
- property margin: int | float | Decimal | None
If there are multiple axes on the same side of the chart, the margin between the axes, expressed in pixels. Defaults to
0for vertical axes,15for horizontal axes.- Return type:
numeric or
None
- property max: int | float | Decimal | date | datetime | None
The maximum value of the axis. If
None, themaxvalue is automatically calculated. Defaults toNone.Note
If the
GenericAxis.end_on_tick()isTrue, themaxvalue might be rounded up.Warning
If a
GenericAxis.tick_amount()is set, the axis may be extended beyond the setmaxin order to reach the given number of ticks. The same may happen in a chart with multiple axes, determined byChart.align_ticks()where atick_amountis applied internally.- Return type:
numeric or
None
- property max_padding: int | float | Decimal | None
Padding of the max value relative to the length of the axis. Defaults to
0.01.For example, a value of
0.05will make a 100px axis 5px longer.Hint
This is useful when you don’t want the highest data value to appear on the edge of the plot area.
Warning
When the
GenericAxis.max()option is set or a max extreme is set using (JavaScript)axis.setExtremes(), themax_paddingwill be ignored.- Return type:
numeric or
None
- property max_range: int | float | Decimal | None
Maximum range which can be set using the navigator’s handles. Defaults to
None.Note
This setting is the opposite of
.min_range- Return type:
numeric or
None
- property min: int | float | Decimal | date | datetime | None
The minimum value of the axis. If
None, theminvalue is automatically calculated. Defaults toNone.Note
If the
GenericAxis.start_on_tick()isTrue, theminvalue might be rounded down.Warning
The automatically-calculated
minvalue is also affected by:GenericAxis.floor()GenericAxis.soft_min()GenericAxis.min_padding()GenericAxis.min_range()GenericTypeOptions.threshold()SeriesOptions.soft_threshold()
- Return type:
numeric or
None
- property min_padding: int | float | Decimal | None
Padding of the min value relative to the length of the axis. Defaults to
0.01.For example, a value of
0.05will make a 100px axis 5px longer.Hint
This is useful when you don’t want the lowest data value to appear on the edge of the plot area.
Warning
When the
GenericAxis.min()option is set or a min extreme is set using (JavaScript)axis.setExtremes(), themin_paddingwill be ignored.- Return type:
numeric or
None
- property min_range: int | float | Decimal | None
The minimum range to display on this axis. The entire axis will not be allowed to span over a smaller interval than this, particularly when zooming. Defaults to
None.For example, for a datetime axis the main unit is milliseconds. If
min_rangeis set to3600000, the user won’t be able to zoom in more than to one hour.If
None, themin_rangefor the x-axis will automatically be set to five times the smallest interval between any of the data points.On a logarithmic axis, the unit for the minimum range is the power. So a
min_rangeof1means that the axis can be zoomed to 10-100, 100-1000, 1000-10,000 etc.Warning
The following settings also impact how the extremes of the axis are computed:
NumericAxis.min_padding()NumericAxis.max_padding()NumericAxis.start_on_tick()NumericAxis.end_on_tick()
- Return type:
numeric or
None
- property min_tick_interval: int | float | Decimal | None
The minimum tick interval allowed in axis values. Defaults to
None, which applies the closest distance between two points on the axis.For example, this setting can be used to prevent the axis from showing hours as minor tick marks.
- Return type:
numeric or
None
- property minor_grid_line_color: str | Gradient | Pattern | None
Color of the minor (secondary) grid lines. Defaults to
'#f2f2f2'.
- property minor_grid_line_dash_style: str | None
Name of the dash style to use for the grid lines. Defaults to
Solid.Accepts one of the following values:
‘Dash’,
‘DashDot’,
‘Dot’,
‘LongDash’,
‘LongDashDot’,
‘LongDashDotDot’,
‘ShortDash’,
‘ShortDashDot’,
‘ShortDashDotDot’,
‘ShortDot’,
‘Solid’
- property minor_grid_line_width: int | float | Decimal | None
Width of the minor, secondary grid lines. Defaults to
1.- Return type:
numeric or
None
- property minor_tick_color: str | Gradient | Pattern | None
Color for the minor tick marks. Defaults to
'#999999'.
- property minor_tick_interval: int | float | Decimal | str | None
Specific tick interval in axis units for the minor ticks. Defaults to
None.On a linear axis, if
"auto", the minor tick interval is calculated as a fifth of theGenericAxis.tick_interval(). IfNone, minor ticks are not shown.On logarithmic axes, the unit is the power of the value. For example, setting the
minor_tick_intervalto1puts one tick on each of 0.1, 1, 10, 100, etc. Setting the value to0.1produces 9 ticks between 1 and 10, 10 and 100 etc.
- property minor_tick_length: int | float | Decimal | None
The length of the minor tick marks, in pixels. Defaults to
2.- Return type:
numeric or
None
- property minor_tick_position: str | None
The position of the minor tick marks relative to the axis line. Defaults to
'outside'.Accepts either:
'outside''inside'
- property minor_tick_width: int | float | Decimal | None
The width of the minor tick marks, in pixels. Defaults to
0.- Return type:
numeric or
None
- property minor_ticks: bool | None
Enable (
True) or disable (False) minor ticks. Defaults toFalse.Note
Unless
GenericAxis.minor_tick_interval()is set, the minor tick interval is calculated as a fifth of the tickInterval.Note
On a logarithmic axis, minor ticks are laid out based on a best guess, attempting to fit approximately 5 minor ticks between each major tick.
Warning
On category axes (where text is displayed in each position, rather than a numerical value), minor ticks are not supported.
- property minor_ticks_per_major: int | float | Decimal | None
The number of minor ticks per major tick. Defaults to
5.Note
Works for
linear,logarithmicanddatetimeaxes.- Return type:
numeric or
None
- property offset: int | float | Decimal | None
The distance in pixels from the plot area to the axis line. Defaults to
None.A positive offset moves the axis (along with its line, labels, and ticks) away from the plot area. This is typically used when two or more axes are displayed on the same side of the plot.
With multiple axes, the
offsetis dynamically adjusted to avoid collision, though this can be overridden by settingoffsetexplicitly.- Return type:
numeric or
None
- property opposite: bool | None
If
True, displays the axis on the opposite side of where it would normally appear. Defaults toFalse.Vertical axes would normally appear on the left side of the chart, while horizontal axes would normally appear on the bottom of the chart. Thus, the opposite side would be the right and top respectively.
Hint
This feature is typically used with dual or multiple axes.
- property overscroll: int | None
Additional range on the right side of the x-axis. Works similar to
.max_padding, but value is set in milliseconds. Defaults to0.
- property pane: int | None
Indicates the index in the panes array. When
None, the first pane will be used. Defaults toNone.Warning
Used for circular gauges and polar charts.
- property panning_enabled: bool | None
If
True, allows the axis to pan.Falseprevents the axis from panning. Defaults toTrue.Note
If
Chart.panning()isTrueand this option isFalse, then this specific axis will not pan.
- property plot_bands: List[PlotBand] | None
A collection of colored bands stretching across the plot area which can be used to visually mark an interval along the axis. Defaults to
None.Note
In a gauge chart, a plot band on the
YAxis(value axis) will stretch along the perimeter of the gauge.
- property plot_lines: List[PlotLine] | None
A collection of lines stretching across the plot area which can be used to visually mark specific values on the axis. Defaults to
None.
- property range: int | float | Decimal | None
The minimum range to display on this axis. Defaults to
None.Note
The entire axis will not be allowed to span over a smaller interval than this. For example, for a datetime axis the main unit is milliseconds. If
min_rangeis set to3600000, you can’t zoom in more than to one hour.On a logarithmic axis, the unit for the range is the power. So a
rangeof1means that the axis can be zoomed to 10-100, 100-1,000, 1,000-10,000 etc.Note
For the x-axis, when
None, defaults to five times the smallest interval between any of the data points.Caution
The
min_padding,max_padding,start_on_tick, andend_on_ticksettings also affect how the extremes of the axis are computed.- Return type:
numeric or
None
- property reversed: bool | None
If
True, reverses the axis so that the highest number is closest to the origin. Defaults toNone.Note
If the chart is inverted, the
XAxisis reversed by default.
- property reversed_stacks: bool | None
This option determines how stacks should be ordered within a group. Setting this to
Truewill reverse the order of series within a group relative to its automatic ordering.For example, if
XAxis.reversed`isTrue, then the default behavior is to reverse the order of the series so that the first series comes last in a group. To retain the original order, set this option toTrue.
- property scrollbar: Scrollbar | None
An optional scrollbar to display on the X axis in response to limiting the minimum and maximum of the axis values. Defaults to
None.- Return type:
ScrollbarorNone
- property show_empty: bool | None
If
True, render the axis title and axis line even if the axis has no data. IfFalse, does not render the axis when the axis has no data. Defaults toTrue.
- property show_first_label: bool | None
If
True, renders the first tick label by the axis. Defaults toTrue.
- property show_last_label: bool | None
If
True, renders the last tick label by the axis. IfNone, defaults toTrueon cartesian charts andFalseon polar charts.
- property soft_max: int | float | Decimal | None
A soft maximum for the axis. Defaults to
None.If the series data maximum is less than this, the axis will stay at this maximum, but if the series data maximum is higher than this value, the axis will flex to show all data.
- Return type:
numeric or
None
- property soft_min: int | float | Decimal | None
A soft minimum for the axis. Defaults to
None.If the series data minimum is less than this, the axis will stay at this minimum, but if the series data minimum is higher than this value, the axis will flex to show all data.
- Return type:
numeric or
None
- property start_of_week: int | None
For datetime axes, this decides where to put the tick between weeks. Defaults to
1(Monday).Note
0= Sunday,1= Monday, etc.Hint
As a convenience, if you supply a string with the day of week (e.g.
'Monday'), the Highcharts for Python library wlil automatically convert it to the appropriate numerical value.
- property start_on_tick: bool | None
If
Trueforces the axis to start on a tick. Defaults toFalseforXAxis,TrueforYAxis, andFalseforZAxis.Hint
Use this option with the
GenericAxis.min_padding()setting to control the axis start.Warning
This option is always disabled on a
YAxis, when panning type is eitheryorxy.
- property tick_amount: int | None
The amount of ticks to draw on the axis. Defaults to
None.Hint
This provides greater control for aligning the ticks of multiple charts or panes within a chart.
Warning
This option overrides the
GenericAxis.tick_pixel_interval()option.Note
This option only has an effect on linear axes. Datetime, logarithmic, or category axes are not affected.
- property tick_color: str | Gradient | Pattern | None
Color for the main tick marks. Defaults to
'#ccd6eb'.
- property tick_interval: int | float | Decimal | None
The interval of the tick marks in axis units. Defaults to
None.When
None, thetick_intervalis automatically computed to approximately followGenericAxis.tick_pixel_interval()on linear and datetime axes. On category axes,Nonewill default to1(one category).Note
Datetime axes are based on milliseconds, so for example an interval of one day is expressed as
24 * 3600 * 1000.On logarithmic axes, the unit is the power of the value. For example, setting the
tick_intervalto1puts one tick on each of 0.1, 1, 10, 100, etc. Setting the value to0.1produces 9 ticks between 1 and 10, 10 and 100 etc.Warning
If the chart has multiple axes, the
GenericAxis.align_ticks()setting may interfere withtick_interval.
- property tick_length: int | float | Decimal | None
The length of the main tick marks, in pixels. Defaults to
10.- Return type:
numeric or
None
- property tick_pixel_interval: int | float | Decimal | None
If
tick_intervalisNone, this setting establishes the approximate interval between major tick marks, expressed in pixels. Defaults to100.Warning
Does not apply to categorized axes.
Note
The tick interval is also influenced by the
min_tick_intervalsetting, which, by default, prevents ticks from being denser than the data points.- Return type:
numeric or
None
- property tick_position: str | None
The position of the major tick marks relative to the axis line. Defaults to
'outside'.Accepts either:
'outside''inside'
- property tick_positioner: CallbackFunction | None
A JavaScript callback function returning an array defining where the ticks are laid out on the axis.
Warning
This overrides the default behaviour of
tick_pixel_intervalandtick_interval.The automatic tick positions are accessible (in JavaScript) through
this.tickPositionsand can be modified by the callback.- Return type:
CallbackFunctionorNone
- property tick_positions: List[int | float | Decimal] | None
An array that explicitly positions the major tick marks along the axis. Defaults to
None.Warning
Setting tick positions explicitly using this setting overrides the default behavior of
tick_pixel_intervalandtick_interval.
- property tick_width: int | float | Decimal | None
The width of the main tick marks, in pixels. Defaults to
0on category axes, otherwise defaults to1.- Return type:
numeric or
None
- property tickmark_placement: str | None
If
'on', the tick mark is placed in the center of the category. If'between', the tick mark is placed between categories. IfNone, defaults to'between'iftick_intervalis1, otherwise defaults to'on'.Warning
Applies to category axes only.
- property title: AxisTitle | None
The axis title, displayed next to the axis line. Defaults to
None.- Return type:
AxisTitleorNone
- property top: int | float | Decimal | str | None
The top position of the axis when operating as a vertical axis, expresesd as the pixel position relative to the chart or a percentage of the plot width, offset from the plot area’s
topposition. Defaults toNone.
- property type: str | None
The type of axis. Defaults to
'linear'.Accepts the following values:
'linear''logarithmic''datetime''category'
Note
In a
'datetime'axis, the numbers are given in milliseconds, and tick marks are placed on appropriate values like full hours or days.Note
In a
'category'axis, either thecategoriessetting determines the categories rendered on the axis, or the categories are derived from the point names of the chart’s series.
- property unique_names: bool | None
If
True, points are placed on the axis according to their names. If the same point name is repeated in the same or another series, the point is placed on the same axis position as other points of the same name. WhenFalse, the points are laid out in increasing positions regardless of their names, and the axis category will take the name of the last point in each position. Defaults toTrue.Warning
Applies only to category axes.
- property units: List[List[str | List[int | float | Decimal | EnforcedNullType | None]]] | None
An array determining what time intervals the data is allowed to be grouped to. Each array item is an array where the first value is the time unit expressed as a
strand the second value is another array of allowed multiples.Warning
Only applies to datetime axes.
Defaults to
None, which behaves as:{ 'units': [ [ 'millisecond', # unit name [1, 2, 5, 10, 20, 25, 50, 100, 200, 500] # allowed multiples ], [ 'second', [1, 2, 5, 10, 15, 30] ], [ 'minute', [1, 2, 5, 10, 15, 30] ], [ 'hour', [1, 2, 3, 4, 6, 8, 12] ], [ 'day', [1] ], [ 'week', [1] ], [ 'month', [1, 3, 6] ], [ 'year', None ] ] }
- property visible: bool | None
If
True, renders the axis (including title, line, ticks, and labels). IfFalse, hides the axis (including title, line, ticks, and labels). Defaults toTrue.
- property width: int | float | Decimal | str | None
The width of the axis when operating as the vertical axis, expressed either in pixels or as a percentage of the total plot width. Defaults to
None.
- property z_index: int | float | Decimal | None
The Z-index for the axis group (including title, line, ticks, and labels). Defaults to
'2'.- Return type:
numeric or
None