.labels
class: AxisLabelOptions
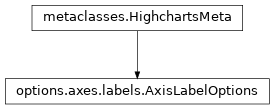
- class AxisLabelOptions(**kwargs)[source]
Settings for the axis labels, which show the number or category for each tick.
Class Inheritance
- copy(other=None, overwrite=True, **kwargs)
Copy the configuration settings from this instance to the
otherinstance.- Parameters:
other (
HighchartsMeta) – The target instance to which the properties of this instance should be copied. IfNone, will create a new instance and populate it with properties copied fromself. Defaults toNone.overwrite (
bool) – ifTrue, properties inotherthat are already set will be overwritten by their counterparts inself. Defaults toTrue.kwargs – Additional keyword arguments. Some special descendents of
HighchartsMetamay have special implementations of this method which rely on additional keyword arguments.
- Returns:
A mutated version of
otherwith new property values
- classmethod from_dict(as_dict: dict, allow_snake_case: bool = True)
Construct an instance of the class from a
dictobject.
- classmethod from_js_literal(as_str_or_file, allow_snake_case: bool = True, _break_loop_on_failure: bool = False)
Return a Python object representation of a Highcharts JavaScript object literal.
- Parameters:
as_str_or_file (
str) – The JavaScript object literal, represented either as astror as a filename which contains the JS object literal.allow_snake_case (
bool) – IfTrue, interpretssnake_casekeys as equivalent tocamelCasekeys. Defaults toTrue._break_loop_on_failure (
bool) – IfTrue, will break any looping operations in the event of a failure. Otherwise, will attempt to repair the failure. Defaults toFalse.
- Returns:
A Python object representation of the Highcharts JavaScript object literal.
- Return type:
HighchartsMeta
- classmethod from_json(as_json_or_file, allow_snake_case: bool = True)
Construct an instance of the class from a JSON string.
- Parameters:
as_json_or_file – The JSON string for the object or the filename of a file that contains the JSON string.
allow_snake_case (
bool) – IfTrue, interpretssnake_casekeys as equivalent tocamelCasekeys. Defaults toTrue.
- Returns:
A Python objcet representation of
as_json.- Return type:
HighchartsMeta
- get_required_modules(include_extension=False) List[str]
Return the list of URLs from which the Highcharts JavaScript modules needed to render the chart can be retrieved.
- to_dict() dict
Generate a
dictrepresentation of the object compatible with the Highcharts JavaScript library.Note
The
dictrepresentation has a property structure and naming convention that is intentionally consistent with the Highcharts JavaScript library. This is not Pythonic, but it makes managing the interplay between the two languages much, much simpler.
- to_js_literal(filename=None, encoding='utf-8', careful_validation=False) str | None
Return the object represented as a
strcontaining the JavaScript object literal.- Parameters:
along the way using the esprima-python library. Defaults to
False.Warning
Setting this value to
Truewill significantly degrade serialization performance, though it may prove useful for debugging purposes.
- to_json(filename=None, encoding='utf-8')
Generate a JSON string/byte string representation of the object compatible with the Highcharts JavaScript library.
Note
This method will either return a standard
stror abytesobject depending on the JSON serialization library you are using. For example, if your environment has orjson, the result will be abytesrepresentation of the string.- Parameters:
- Returns:
A JSON representation of the object compatible with the Highcharts library.
- Return type:
- static trim_dict(untrimmed: dict, to_json: bool = False, context: str = None) dict
Remove keys from
untrimmedwhose values areNoneand convert values that have.to_dict()methods.- Parameters:
untrimmed (
dict) – Thedictwhose values may still beNoneor Python objects.to_json (
bool) – IfTrue, will remove all keys fromuntrimmedthat are not serializable to JSON. Defaults toFalse.context (
strorNone) – If provided, will inform the method of the context in which it is being run which may inform special handling cases (e.g. where empty strings may be important / allowable). Defaults toNone.
- Returns:
Trimmed
dict- Return type:
- static trim_iterable(untrimmed, to_json=False, context: str = None)
Convert any
EnforcedNullTypevalues inuntrimmedto'null'.- Parameters:
untrimmed (iterable) – The iterable whose members may still be
Noneor Python objects.to_json (
bool) – IfTrue, will remove all members fromuntrimmedthat are not serializable to JSON. Defaults toFalse.context (
strorNone) – If provided, will inform the method of the context in which it is being run which may inform special handling cases (e.g. where empty strings may be important / allowable). Defaults toNone.
- Return type:
iterable
- property align: str | None
The part of the string the given position is anchored to. If
'left', the left side of the string is at the axis position. Defaults toNone, which leads Highcharts to determine the label alignment based on which side of the chart the axis is placed on and the rotation of the label.Accepts:
'left''center''right'
- Return type:
- property allow_overlap: bool | None
If
True, allows the axis labels to overlap. WhenFalse, overlapping labels are hidden. Defaults toFalse.- Return type:
- property auto_rotation: List[int | float | Decimal | Type[None]] | None
For horizontal axes, provides the allowed degrees of label rotation to prevent overlapping labels.
If there is enough space, labels are not rotated. As the chart gets narrower, it will start rotating the labels by the measurements contained in
auto_rotationin sequence. If they still do not fit, then Highcharts will start removing every second label, and rotating through the sequence again, etc.Include
Nonein the collection to disable automatic rotation, at that step in the sequence - which will cause the labels to word-wrap if possible.If set to
None, defaults to[-45]on bottom and top axes, andNone(word-wrapping) on left and right axes.
- property auto_rotation_limit: int | None
The category width threshold at which auto rotation ceases to be applied. When each category width is more than this many pixels, auto rotation is not applied. Instead, the axis label is laid out with word wrapping. Defaults to
80.Hint
A lower limit makes sense when the label contains multiple short words that don’t extend the available horizontal space for each label.
- Return type:
- property distance: int | float | Decimal | str | None
The label’s pixel distance from the perimeter of the plot area.
Changed in version Highcharts: for Python v.1.2.0 + Highcharts Core (JS) v.11.1
If not specified, defaults to
8.Warning
On cartesian charts, this is overridden if the
.xproperty is set.On polar charts, if it’s a percentage string, it is interpreted the same as
SolidGaugeOptions.radius, so that the label can be aligned under the gauge’s shape.
- property enabled: bool | None
Enable or disable the axis labels. Setting to
Nonebehaves as if set toTrue.
- property format: str | None
Format string that is applied to the axis labels. Defaults to
None.Context is available as format string variables. For example, you can use
'{text}'to insert the default formatted text. The recommended way of adding units for the label is using text, for example'{text} km'.To add custom numeric or datetime formatting, use
'{value}'with formatting, for example'{value:.1f}'or'{value:%Y-%m-%d}'.
- property formatter: CallbackFunction | None
JavaScript callback function to format the axis label. Defaults to
None, which applies a built-in function which returns a formatted string depending on whether the axis is a category, datetime, linear/logarithmic, etc. axis type.Note
The value is available in (JavaScript)
this.value. Additional properties forthisareaxis,chart,isFirst,isLast, andtextwhich holds the value of the default formatter.
- property overflow: str | None
Configuration on how to handle an axis label on the horizontal axis that overflows. If set to
'allow', it will not be aligned at all. Defaults to'justify', which attempts to align the label to the edge of the axis and on failure removes the label.Accepts:
'justify'- which attempts to fit the label to the edge of the axis'allow'- which allows axis labels to overflow outside of the axis area
- property padding: int | float | Decimal | None
The padding for axis labels, expressed in pixels (used to ensure white space between the labels). Defaults to
5.
- property position_3d: str | None
Defines how the labels are to be repositioned according to the 3D chart orientation. Defaults to
'offset'.Accepts the following values:
'offset'(the default) - maintains a fixed horizontal/vertical distance from the tick marks, despite the chart orientation. This is backwards-compatible behavior, and causes skewing of X and Z axes.'chart'- preserve the 3D position relative to the chart. This looks nice, but it is hard to read if the text isn’t forward-facing.'flap'- rotated text along the axis to compensate for the chart orientation. This tries to maintain text as legible as possible on all orientations.'ortho'- rotates text along the axis direction so that the labels are orthogonal to the axis. This is very similar to'flap', but prevents skewing the labels (X and Y scaling are still present).
- property reserve_space: bool | None
If
True, reserve space for the labels. IfNone, by default space is reserved for the labels in these cases:On all horizontal axes.
On vertical axes if
AxisLabelOptions.align()is'right'on a left-side axis or'left'on a right-side axis.On vertical axes if
AxisLabelOptions.align()is'center'.
This can be turned off (set to
False), for example, when the labels are rendered inside the plot area instead of outside.
- property rotation: int | float | Decimal | None
Rotation of the axis label in degrees. When
None, theauto_rotationsetting takes precedence but otherwise defaults to0.- Return type:
numeric or
None
- property skew_3d: bool | None
If
True, the axis labels will skewed to follow the perspective. Defaults toFalse.Note
Setting this to
Truewill fix overlapping labels and titles, but texts become less legible due to the distortion. The final appearance depends heavily onposition_3d.
- property stagger_lines: int | None
The number of lines to spread the labels over to make room or tighter labels. Defaults to
0.Hint
Setting the value to
0disables staggering.Warning
Only applies to horizontal axes only.
- property step: int | None
To show only every n th label on the axis, set the step to n. For example, setting the step to
2will render every other label. Defaults to0.Warning
When set to
0, the step is automatically calculated to avoid overlap. To prevent this behavior, set to1. This usually only happens on a category axis, and is often a sign that you have chosen the wrong axis type.
- property style: str | dict | None
CSS styling to apply to the axis label. Defaults to
None.Hint
Use
"whiteSpace: 'nowrap'"to prevent wrapping of category labels.Hint
Use
"textOverflow: 'one'"to prevent ellipsis (three dots).
- property use_html: bool | None
If
True, will use HTML to render the axis label. IfFalse, will use SVG or WebGL as applicable.Defaults to
False.
- property x: int | float | Decimal | None
The x position offset of all labels relative to the tick positions on the axis.
Changed in version Highcharts: Core for Python v.2.0.0 / Highcharts Core (JS) v.11.
Note
If set, overrides the
.distanceproperty.- Return type:
numeric or
None
class: PlotBandLabel
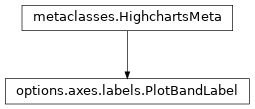
- class PlotBandLabel(**kwargs)[source]
Text label for a Plot Band.
Class Inheritance
- copy(other=None, overwrite=True, **kwargs)
Copy the configuration settings from this instance to the
otherinstance.- Parameters:
other (
HighchartsMeta) – The target instance to which the properties of this instance should be copied. IfNone, will create a new instance and populate it with properties copied fromself. Defaults toNone.overwrite (
bool) – ifTrue, properties inotherthat are already set will be overwritten by their counterparts inself. Defaults toTrue.kwargs – Additional keyword arguments. Some special descendents of
HighchartsMetamay have special implementations of this method which rely on additional keyword arguments.
- Returns:
A mutated version of
otherwith new property values
- classmethod from_dict(as_dict: dict, allow_snake_case: bool = True)
Construct an instance of the class from a
dictobject.
- classmethod from_js_literal(as_str_or_file, allow_snake_case: bool = True, _break_loop_on_failure: bool = False)
Return a Python object representation of a Highcharts JavaScript object literal.
- Parameters:
as_str_or_file (
str) – The JavaScript object literal, represented either as astror as a filename which contains the JS object literal.allow_snake_case (
bool) – IfTrue, interpretssnake_casekeys as equivalent tocamelCasekeys. Defaults toTrue._break_loop_on_failure (
bool) – IfTrue, will break any looping operations in the event of a failure. Otherwise, will attempt to repair the failure. Defaults toFalse.
- Returns:
A Python object representation of the Highcharts JavaScript object literal.
- Return type:
HighchartsMeta
- classmethod from_json(as_json_or_file, allow_snake_case: bool = True)
Construct an instance of the class from a JSON string.
- Parameters:
as_json_or_file – The JSON string for the object or the filename of a file that contains the JSON string.
allow_snake_case (
bool) – IfTrue, interpretssnake_casekeys as equivalent tocamelCasekeys. Defaults toTrue.
- Returns:
A Python objcet representation of
as_json.- Return type:
HighchartsMeta
- get_required_modules(include_extension=False) List[str]
Return the list of URLs from which the Highcharts JavaScript modules needed to render the chart can be retrieved.
- to_dict() dict
Generate a
dictrepresentation of the object compatible with the Highcharts JavaScript library.Note
The
dictrepresentation has a property structure and naming convention that is intentionally consistent with the Highcharts JavaScript library. This is not Pythonic, but it makes managing the interplay between the two languages much, much simpler.
- to_js_literal(filename=None, encoding='utf-8', careful_validation=False) str | None
Return the object represented as a
strcontaining the JavaScript object literal.- Parameters:
along the way using the esprima-python library. Defaults to
False.Warning
Setting this value to
Truewill significantly degrade serialization performance, though it may prove useful for debugging purposes.
- to_json(filename=None, encoding='utf-8')
Generate a JSON string/byte string representation of the object compatible with the Highcharts JavaScript library.
Note
This method will either return a standard
stror abytesobject depending on the JSON serialization library you are using. For example, if your environment has orjson, the result will be abytesrepresentation of the string.- Parameters:
- Returns:
A JSON representation of the object compatible with the Highcharts library.
- Return type:
- static trim_dict(untrimmed: dict, to_json: bool = False, context: str = None) dict
Remove keys from
untrimmedwhose values areNoneand convert values that have.to_dict()methods.- Parameters:
untrimmed (
dict) – Thedictwhose values may still beNoneor Python objects.to_json (
bool) – IfTrue, will remove all keys fromuntrimmedthat are not serializable to JSON. Defaults toFalse.context (
strorNone) – If provided, will inform the method of the context in which it is being run which may inform special handling cases (e.g. where empty strings may be important / allowable). Defaults toNone.
- Returns:
Trimmed
dict- Return type:
- static trim_iterable(untrimmed, to_json=False, context: str = None)
Convert any
EnforcedNullTypevalues inuntrimmedto'null'.- Parameters:
untrimmed (iterable) – The iterable whose members may still be
Noneor Python objects.to_json (
bool) – IfTrue, will remove all members fromuntrimmedthat are not serializable to JSON. Defaults toFalse.context (
strorNone) – If provided, will inform the method of the context in which it is being run which may inform special handling cases (e.g. where empty strings may be important / allowable). Defaults toNone.
- Return type:
iterable
- property align: str | None
Horizontal alignment of the label.
Accepts:
'left''center''right'
- Return type:
- property rotation: int | float | Decimal | None
Rotation of the label in degrees. Defaults to
0.- Return type:
numeric or
None
- property text: str | None
The string text itself.
Note
A subset of HTML is supported, e.g.
<b>,<i>, etc.
- property text_align: str | None
The text alignment for the label. Defaults to
None, which applies the same value as thePlotBandLabel.align()setting.Note
While
PlotBandLabel.align()determines where the text’s anchor point is placed within the plot band,text_aligndetermines how the text is aligned against its anchor point.Possible values are:
'left''center''right'
- Return type:
- property use_html: bool | None
If
True, will use HTML to render the label. IfFalse, will use SVG or WebGL as applicable.Defaults to
False.
- property vertical_align: str | None
Vertical alignment of the label relative to the plot band. Defaults to
'top'.Accepts:
'top''middle''bottom'
class: PlotLineLabel
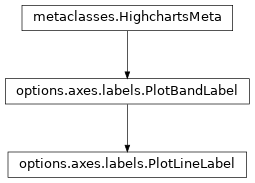
- class PlotLineLabel(**kwargs)[source]
Text label applied to a Plot Line.
Class Inheritance
- copy(other=None, overwrite=True, **kwargs)
Copy the configuration settings from this instance to the
otherinstance.- Parameters:
other (
HighchartsMeta) – The target instance to which the properties of this instance should be copied. IfNone, will create a new instance and populate it with properties copied fromself. Defaults toNone.overwrite (
bool) – ifTrue, properties inotherthat are already set will be overwritten by their counterparts inself. Defaults toTrue.kwargs – Additional keyword arguments. Some special descendents of
HighchartsMetamay have special implementations of this method which rely on additional keyword arguments.
- Returns:
A mutated version of
otherwith new property values
- classmethod from_dict(as_dict: dict, allow_snake_case: bool = True)
Construct an instance of the class from a
dictobject.
- classmethod from_js_literal(as_str_or_file, allow_snake_case: bool = True, _break_loop_on_failure: bool = False)
Return a Python object representation of a Highcharts JavaScript object literal.
- Parameters:
as_str_or_file (
str) – The JavaScript object literal, represented either as astror as a filename which contains the JS object literal.allow_snake_case (
bool) – IfTrue, interpretssnake_casekeys as equivalent tocamelCasekeys. Defaults toTrue._break_loop_on_failure (
bool) – IfTrue, will break any looping operations in the event of a failure. Otherwise, will attempt to repair the failure. Defaults toFalse.
- Returns:
A Python object representation of the Highcharts JavaScript object literal.
- Return type:
HighchartsMeta
- classmethod from_json(as_json_or_file, allow_snake_case: bool = True)
Construct an instance of the class from a JSON string.
- Parameters:
as_json_or_file – The JSON string for the object or the filename of a file that contains the JSON string.
allow_snake_case (
bool) – IfTrue, interpretssnake_casekeys as equivalent tocamelCasekeys. Defaults toTrue.
- Returns:
A Python objcet representation of
as_json.- Return type:
HighchartsMeta
- get_required_modules(include_extension=False) List[str]
Return the list of URLs from which the Highcharts JavaScript modules needed to render the chart can be retrieved.
- to_dict() dict
Generate a
dictrepresentation of the object compatible with the Highcharts JavaScript library.Note
The
dictrepresentation has a property structure and naming convention that is intentionally consistent with the Highcharts JavaScript library. This is not Pythonic, but it makes managing the interplay between the two languages much, much simpler.
- to_js_literal(filename=None, encoding='utf-8', careful_validation=False) str | None
Return the object represented as a
strcontaining the JavaScript object literal.- Parameters:
along the way using the esprima-python library. Defaults to
False.Warning
Setting this value to
Truewill significantly degrade serialization performance, though it may prove useful for debugging purposes.
- to_json(filename=None, encoding='utf-8')
Generate a JSON string/byte string representation of the object compatible with the Highcharts JavaScript library.
Note
This method will either return a standard
stror abytesobject depending on the JSON serialization library you are using. For example, if your environment has orjson, the result will be abytesrepresentation of the string.- Parameters:
- Returns:
A JSON representation of the object compatible with the Highcharts library.
- Return type:
- static trim_dict(untrimmed: dict, to_json: bool = False, context: str = None) dict
Remove keys from
untrimmedwhose values areNoneand convert values that have.to_dict()methods.- Parameters:
untrimmed (
dict) – Thedictwhose values may still beNoneor Python objects.to_json (
bool) – IfTrue, will remove all keys fromuntrimmedthat are not serializable to JSON. Defaults toFalse.context (
strorNone) – If provided, will inform the method of the context in which it is being run which may inform special handling cases (e.g. where empty strings may be important / allowable). Defaults toNone.
- Returns:
Trimmed
dict- Return type:
- static trim_iterable(untrimmed, to_json=False, context: str = None)
Convert any
EnforcedNullTypevalues inuntrimmedto'null'.- Parameters:
untrimmed (iterable) – The iterable whose members may still be
Noneor Python objects.to_json (
bool) – IfTrue, will remove all members fromuntrimmedthat are not serializable to JSON. Defaults toFalse.context (
strorNone) – If provided, will inform the method of the context in which it is being run which may inform special handling cases (e.g. where empty strings may be important / allowable). Defaults toNone.
- Return type:
iterable
- property align: str | None
Horizontal alignment of the label.
Accepts:
'left''center''right'
- Return type:
- property formatter: CallbackFunction | None
JavaScript callback function to format the label. Defaults to
None.Hint
Useful properties like the value of the plot line or the range of the plot band (
PlotBand.from()&toproperties) can be found in the (JavaScript)this.optionsobject.- Return type:
CallbackFunctionorNone
- property rotation: int | float | Decimal | None
Rotation of the label in degrees. Defaults to
0.- Return type:
numeric or
None
- property text: str | None
The string text itself.
Note
A subset of HTML is supported, e.g.
<b>,<i>, etc.
- property text_align: str | None
The text alignment for the label. Defaults to
None, which applies the same value as thePlotBandLabel.align()setting.Note
While
PlotBandLabel.align()determines where the text’s anchor point is placed within the plot band,text_aligndetermines how the text is aligned against its anchor point.Possible values are:
'left''center''right'
- Return type:
- property use_html: bool | None
If
True, will use HTML to render the label. IfFalse, will use SVG or WebGL as applicable.Defaults to
False.
- property vertical_align: str | None
Vertical alignment of the label relative to the plot band. Defaults to
'top'.Accepts:
'top''middle''bottom'