Quickstart: Patterns and Best Practices
Installation
To install Highcharts Gantt for Python, just execute:
$ pip install highcharts-gantt
Importing Highcharts Gantt for Python Objects
Tip
Best Practice!
This method of importing Highcharts Gantt for Python objects yields the fastest
performance for the import statement. However, it is more verbose and requires
you to navigate the extensive Highcharts Gantt for Python API.
# Import classes using precise module indications. For example:
from highcharts_gantt.chart import Chart
from highcharts_gantt.global_options.shared_options import SharedGanttOptions
from highcharts_gantt.options import HighchartsGanttOptions
from highcharts_gantt.options.plot_options.gantt import GanttOptions
from highcharts_gantt.options.series.gantt import GanttSeries
Caution
This method of importing Highcharts Gantt for Python classes has relatively slow performance because it imports hundreds of different classes from across the entire library. This performance impact may be acceptable to you in your use-case, but do use at your own risk.
# Import objects from the catch-all ".highcharts" module.
from highcharts_gantt import highcharts

# You can now access specific classes without individual import statements.
highcharts.Chart
highcharts.SharedGanttOptions
highcharts.HighchartsGanttOptions
highcharts.GanttOptions
highcharts.GanttSeries
Standardizing Your Charts
Tip
Best practice!
We really like to use JS literals written as separate files in our codebase. It
makes it super simple to instantiate a
SharedGanttOptions
instance with one method call.
Let’s say you organize your files like so:
my_repository/| — docs/| — my_project/| —— project_resources/| ——— image_files/| ——— data_files/| ———— data-file-01.csv| ———— data-file-02.csv| ———— data-file-03.csv| ——— highcharts_config/| ———— shared_options.js| ———— bar-template-01.js| ———— bar-template-02.js| ———— line-template.js| ———— packed-bubble-template.js| —— some_package/| ——— __init__.py| ——— package_module.py| ——— another_module.py| —— __init__.py| —— __version__.py| —— some_module.py| — tests/| — .gitignore| — requirements.txt
You’ll notice that the organization has a project_resources folder. This is where
you would put the various files that your application wlil reference, like your static
images, or the files that contain data you might be using in your application. It also
contains a highcharts_config folder, which contains several files with a .js
extension. Of particular note is the file in bold, shared_options.js. This file
should contain a
JavaScript object literal
version of the configuration settings you want to apply to all of your
visualizations. This file might look something like this:
{
  chart: {
        backgroundColor: {
            linearGradient: {
              x1: 0,
              x2: 0,
              y1: 1,
              y2: 1
            },
            stops: [
                [0, 'rgb(255, 255, 255)'],
                [1, 'rgb(240, 240, 255)']
            ]
        },
        borderWidth: 2,
        plotBackgroundColor: 'rgba(255, 255, 255, .9)',
        plotBorderWidth: 1
  },
  caption: {
      align: 'center',
      floating: true,
      margin: 20,
      verticalAlign: 'top'
  },
  credits: {
      enabled: true,
      href: 'https://www.somewhere.com',
      style: {
          color: '#cccccc',
          fontSize: '8px'
      },
      text: 'Highcharts for Python'
  }
}
Now with this file, you can easily create a
SharedGanttOptions
instance by executing:
from highcharts_gantt.highcharts import SharedGanttOptions

my_shared_options = SharedGanttOptions.from_js_literal('../../project_resources/highcharts_config/shared_options.js')
And that’s it! Now you have a
SharedGanttOptions
instance that can be used to apply your configuration standards to all of your charts.
You can do that by delivering its JavaScript output to your front-end by calling:
js_code_snippet = my_shared_options.to_js_literal()
which will produce a string as follows:
Highcharts.setOptions({
  caption: {
    align: 'center',
    floating: true,
    margin: 20,
    verticalAlign: 'top'
  },
  chart: {
    backgroundColor: {
      linearGradient: {
        x1: 0.0,
        x2: 0.0,
        y1: 1.0,
        y2: 1.0
      },
      stops: [
        [0, 'rgb(255, 255, 255)'],
        [1, 'rgb(240, 240, 255)']
      ]
    },
    borderWidth: 2,
    plotBackgroundColor: 'rgba(255, 255, 255, .9)',
    plotBorderWidth: 1
  },
  credits: {
    enabled: true,
    href: 'https://www.somewhere.com',
    style: {
      color: '#cccccc',
      fontSize: '8px'
    },
    text: 'Highcharts for Python'
  }
});
And now you can deliver js_code_snippet to your HTML template or wherever it will
be rendered.
You can use the same exact pattern as using a JS literal with a JSON file instead. We don’t really think there’s an advantage to this - but there might be one significant disadvantage: JSON files cannot be used to provide JavaScript functions to your Highcharts configuration. This means that formatters, event handlers, etc. will not be applied through your shared options if you use a JSON file.
If your shared options don’t require JavaScript functions? Then by all means, feel
free to use a JSON file and the .from_json() method instead.
With a file structure like:
my_repository/| — docs/| — my_project/| —— project_resources/| ——— image_files/| ——— data_files/| ———— data-file-01.csv| ———— data-file-02.csv| ———— data-file-03.csv| ——— highcharts_config/| ———— shared_options.json| ———— bar-template.json| ———— line-template.json| ———— packed-bubble-template.json| —— some_package/| ——— __init__.py| ——— package_module.py| ——— another_module.py| —— __init__.py| —— __version__.py| —— some_module.py| — tests/| — .gitignore| — requirements.txt
You can leverage shared options that read from
my_project/project_resources/highcharts_config/shared_options.json by executing:
from highcharts_gantt.highcharts import SharedGanttOptions

my_shared_options = SharedGanttOptions.from_js_literal(
    '../../project_resources/highcharts_config/shared_options.json'
)

json_code_snippet = my_shared_options.to_js_literal()
If you are hoping to configure a simple set of options, one of the fastest ways to do
so in your Python code is to instantiate your
SharedGanttOptions
instance from a simple dict:
as_dict = {
    'chart': {
        'backgroundColor': '#fff',
        'borderWidth': 2,
        'plotBackgroundColor': 'rgba(255, 255, 255, 0.9)',
        'plotBorderWidth': 1
    }
}

my_shared_options = SharedGanttOptions.from_dict(as_dict)

js_code_snippet = my_shared_options.to_js_literal()
Tip
This method is particularly helpful and easy to maintain if you are only using a very small subset of the Highcharts (JS) configuration options.
Tip
Best practice!
We really like to use JS literals written as separate files in our codebase. It makes it super simple to instantiate a Highcharts Gantt for Python instance with one method call.
Let’s say you organize your files like so:
my_repository/| — docs/| — my_project/| —— project_resources/| ——— image_files/| ——— data_files/| ———— data-file-01.csv| ———— data-file-02.csv| ———— data-file-03.csv| ——— highcharts_config/| ———— shared_options.js| ———— hlc-template-01.js| ———— hlc-template-02.js| ———— line-template.js| ———— packed-bubble-template.js| —— some_package/| ——— __init__.py| ——— package_module.py| ——— another_module.py| —— __init__.py| —— __version__.py| —— some_module.py| — tests/| — .gitignore| — requirements.txt
As you can see, there are two JS literal files named hlc-template-01.js and
hlc-template-02.js respectively. These template files can be used to significantly
accelerate the configuration of our bar charts. Each template corresponds to one
sub-type of bar chart that we know we will need. These sub-types may have different
event functions, or more frequently use different formatting functions to make the
data look the way we want it to look.
Now with these template files, we can easily create a pair of
Chart instances by executing:
from highcharts_gantt.highcharts import Chart
from highcharts_gantt.options.series.hlc import HLCSeries

type_1_chart = Chart.from_js_literal(
    '../../project_resources/highcharts_config/hlc-template-01.js'
)
type_2_chart = Chart.from_js_literal(
    '../../project_resources/highcharts_config/hlc-template-02.js'
)
And that’s it! Now you have two chart instances which you can further modify. For example, you can add data to them by calling:
type_1_chart.container = 'chart1_div'
type_2_chart.container = 'chart2_div'

type_1_chart.add_series(HLCSeries.from_csv('../../project_resources/data_files/data-file-01.csv'))
type_2_chart.add_series(HLCSeries.from_csv('../../project_resources/data_files/data-file-02.csv'))
And then you can create the relevant JavaScript code to render the chart using:
type_1_chart_js = type_1_chart.to_js_literal()
type_2_chart_js = type_2_chart.to_js_literal()
And now you can deliver type_1_chart_js and type_2_chart_js to your HTML
template or wherever it will be rendered.
If you have an existing Highcharts Gantt for Python instance, you can copy its
properties to another object using the .copy() method. You can therefore set up
one chart, and then copy its properties to other chart objects with one method call.
type_1_chart = Chart.from_js_literal('../../project_resources/highcharts_config/hlc-template-01.js')
other_chart = type_1_chart.copy(other_chart, overwrite = True)
Tip
The
Chart.copy()method supports a special keyword argument,preverse_datawhich if set toTruewill copy properties (unlessoverwrite = False) but will not overwrite any data. This can be very useful to replicating the configuration of your chart across multiple charts that have different series and data.other_chart = Chart() other_chart.add_series( HLCSeries.from_csv('../../project_resources/data_files/data-file-02.csv') ) other_chart = type_1_chart.copy(other_chart, preserve_data = True)
If you are hoping to configure a simple set of template settings, one of the fastest
ways to do so in your Python code is to instantiate your
Chart instance from a simple
dict using the .from_dict() method.
Tip
This method is particularly helpful and easy to maintain if you are only using a very small subset of the Highcharts (JS) configuration options.
Populating Series with Data
Note
The
.from_asana()method is available on theChartandGanttSeriesclasses, allowing you to either assemble a series or an entire chart from an Asana project with only one method call.
from highcharts_gantt.chart import Chart
from highcharts_gantt.options.series.gantt import GanttSeries

# Create a new GanttSeries instance from an Asana project with ID 123456
# - note that this method will automatically read your Asana Personal Access Token from
#   the ASANA_PERSONAL_ACCESS_TOKEN environment variable. You can also supply it
#   directly using the "personal_access_token" keyword argument.
my_series = GanttSeries.from_asana(project_gid = '123456')

# Create a new Chart instance from an Asana project with ID 123456
# - note that this method will automatically read your Asana Personal Access Token from
#   the ASANA_PERSONAL_ACCESS_TOKEN environment variable. You can also supply it
#   directly using the "personal_access_token" keyword argument.
my_chart = Chart.from_asana(project_gid = '123456')
Tip
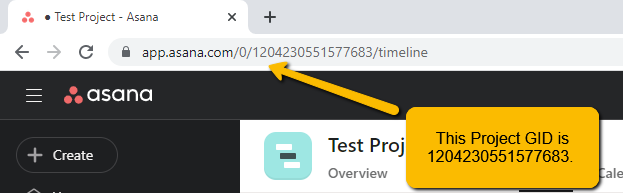
Where to find my Asana Project GID?
Of course, you can find your Asana Project GID using the Asana API, but that is typically a bit cumbersome. The easiest way to find it is to simply grab it out of your browser’s URL bar:

Method Signature
See also
GanttData.from_asana()
- classmethod .from_asana(cls, project_gid, section_gid=None, completed_since=None, use_html_description=True, personal_access_token=None, asana_client=None, api_request_params=None, connection_kwargs=None, connection_callback=None, series_kwargs=None)
Create a
GanttSeriesinstance from an Asana project.Note
Highcharts Gantt for Python can create an Asana API client for you, authenticating using the Personal Access Token method supported by the Asana API. However, if you wish to use the more-involved OAuth2 handshake process you will need to create your own Asana API client using the asana-python library.
The reason for this is because the OAuth2 handshake has various permutations involving redirects, token refreshes, etc. which are outside the scope of the Highcharts Gantt for Python library, and if you are integrating Highcharts Gantt for Python into a larger application you are likely already facilitating the OAuth2 dance in a fashion appropriate for your use case.
- Parameters:
project_gid (
str) –The globally unique ID of the Project whose tasks should be used to assemble the Gantt chart.
Tip
You can find your Asana Project GID in your browser URL bar:
section_gid (
strorNone) – The optional unique ID of the section whose tasks should be used to assemble the Gantt chart. Defaults toNone, which returns all tasks in the project.completed_since (
datetimeorNone) – An optional filter which only returns tasks that have been completed after this date. Defaults toNone, which returns all tasks.use_html_description (
bool) – IfTrue, will use the Asana task’s HTML notes in the data point’s.descriptionfield. IfFalse, will use the non-HTML notes. Defaults toTrue.personal_access_token (
strorNone) – A Personal Access Token created by Asana. Defaults toNone, which tries to determine its value by looking in theASANA_PERSONAL_ACCESS_TOKENenvironment variable.api_request_params (
dictorNone) – Collection of additional request parameters to submit to the Asana API. Defaults toNone.connection_kwargs (
dictorNone) – Set of keyword arugments to supply to theDataConnectionconstructor, besides the.toproperty which is derived from the task. Defaults toNoneconnection_callback (Callable or
None) –A custom Python function or method which accepts two keyword arguments:
connection_target(which expects the dependencydictobject from the Asana task), andasana_task(which expects the Asana taskdictobject). The function should return aDataConnectioninstance. Defaults toNoneTip
The
connection_callbackargument is useful if you want to customize the connection styling based on properties included in the Asana task.series_kwargs (
dictorNone) – Collection of additional keyword arguments to use when instantiating theGanttSeries(besides thedataargument, which will be determined from the Asana tasks). Defaults toNone.
- Returns:
A
GanttSeriespopulated with data from the indicated Asana project/section.- Return type:
GanttSeries- Raises:
HighchartsDependencyError – if the asana Python library is not available in the runtime environment.
HighchartsValueError – if
connection_callbackis notNone, but is not callableHighchartsValueError – if
asana_clientis notNone, but is not a validasana.client.Client>instanceAsanaAuthenticationError – if
asana_clientis not authenticated or if no personal access token is supplied
# Given a GanttSeries named "my_series" and an Asana Project GID of "123456"
my_series.load_from_asana(project_gid = '123456')
Tip
Where to find my Asana Project GID?
Of course, you can find your Asana Project GID using the Asana API, but that is typically a bit cumbersome. The easiest way to find it is to simply grab it out of your browser’s URL bar:
Method Signature
See also
GanttSeries.from_asana()GanttData.from_asana()
- .load_from_asana(self, project_gid, section_gid=None, completed_since=None, use_html_description=True, personal_access_token=None, asana_client=None, api_request_params=None, connection_kwargs=None, connection_callback=None)
Update the
GanttSeriesinstance with data from an Asana project.Note
Highcharts Gantt for Python can create an Asana API client for you, authenticating using the Personal Access Token method supported by the Asana API. However, if you wish to use the more-involved OAuth2 handshake process you will need to create your own Asana API client using the asana-python library.
The reason for this is because the OAuth2 handshake has various permutations involving redirects, token refreshes, etc. which are outside the scope of the Highcharts Gantt for Python library, and if you are integrating Highcharts Gantt for Python into a larger application you are likely already facilitating the OAuth2 dance in a fashion appropriate for your use case.
- Parameters:
project_gid (
str) –The globally unique ID of the Project whose tasks should be used to assemble the Gantt chart.
Tip
You can find your Asana Project GID in your browser URL bar:
section_gid (
strorNone) – The optional unique ID of the section whose tasks should be used to assemble the Gantt chart. Defaults toNone, which returns all tasks in the project.completed_since (
datetimeorNone) – An optional filter which only returns tasks that have been completed after this date. Defaults toNone, which returns all tasks.use_html_description (
bool) – IfTrue, will use the Asana task’s HTML notes in the data point’s.descriptionfield. IfFalse, will use the non-HTML notes. Defaults toTrue.personal_access_token (
strorNone) – A Personal Access Token created by Asana. Defaults toNone, which tries to determine its value by looking in theASANA_PERSONAL_ACCESS_TOKENenvironment variable.api_request_params (
dictorNone) – Collection of additional request parameters to submit to the Asana API. Defaults toNone.connection_kwargs (
dictorNone) – Set of keyword arugments to supply to theDataConnectionconstructor, besides the.toproperty which is derived from the task. Defaults toNoneconnection_callback (Callable or
None) –A custom Python function or method which accepts two keyword arguments:
connection_target(which expects the dependencydictobject from the Asana task), andasana_task(which expects the Asana taskdictobject). The function should return aDataConnectioninstance. Defaults toNoneTip
The
connection_callbackargument is useful if you want to customize the connection styling based on properties included in the Asana task.
- Raises:
HighchartsDependencyError – if the asana Python library is not available in the runtime environment.
HighchartsValueError – if
connection_callbackis notNone, but is not callableHighchartsValueError – if
asana_clientis notNone, but is not a validasana.client.Client>instanceAsanaAuthenticationError – if
asana_clientis not authenticated or if no personal access token is supplied
Note
The
.from_monday()method is available on theChartandGanttSeriesclasses, allowing you to either assemble a series or an entire chart from a Monday.com work board with only one method call.
from highcharts_gantt.chart import Chart
from highcharts_gantt.options.series.gantt import GanttSeries

# Create a new GanttSeries instance from a Monday.com board with ID 123456
# - note that this method will automatically read your Monday.com API Token from
#   the MONDAY_API_TOKEN environment variable. You can also supply it
#   directly using the "api_token" keyword argument.
my_series = GanttSeries.from_monday(board_id = '123456')

# Create a new Chart instance from a Monday.com board ID 123456
# - note that this method will automatically read your Monday.com API Token from
#   the MONDAY_API_TOKEN environment variable. You can also supply it
#   directly using the "api_token" keyword argument.
my_chart = Chart.from_monday(board_id = '123456')
Tip
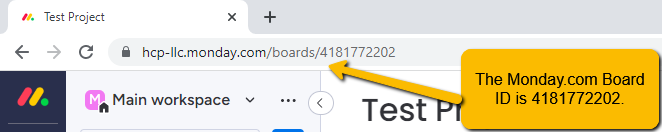
Where to find my Monday.com Board ID?
Of course, you can find your Monday.com Board ID using the Monday.com API, but that is typically a bit cumbersome. The easiest way to find it is to simply grab it out of your browser’s URL bar:

Method Signature
See also
GanttData.from_monday()
- classmethod .from_monday(cls, board_id, api_token=None, template=None, property_column_map=None, connection_kwargs=None, connection_callback=None, series_kwargs=None)
Create a
GanttSeriesinstance from a Monday.com work board.- Parameters:
board_id (
int) –The ID of the Monday.com board whose items should be retrieved to populate the Gantt series.
Tip
You can find your Asana Project GID in your browser URL bar:
The Monday.com API token to use when authenticating your request against the Monday.com API. Defaults to
None, which will then try to determine the token from theMONDAY_API_TOKENenvironment variable.Warning
If no token is either passed to the method or found in the
MONDAY_API_TOKENenvironment variable, calling this method will raise an error.The name of a standard Mpnday.com board template supported by Highcharts for Python. If supplied, will override the
property_column_mapargument. Defaults toNone.Note
If
property_column_mapis set, thetemplateargument will be ignored and overridden byproperty_column_map.property_column_map (
dictorNone) –A
dictused to map Monday.com columns to their correspondingGanttSeriesproperties. Keys are expected to beGanttSeriesproperties, while values are expected to be Monday.com column field names. Defaults toNone.Note
If
property_column_mapis supplied, its settings override thetemplatesetting.connection_kwargs (
dictorNone) – Set of keyword arugments to supply to theDataConnectionconstructor, besides the.toproperty which is derived from the task. Defaults toNoneconnection_callback (Callable or
None) –A custom Python function or method which accepts two keyword arguments:
connection_target(which expects the dependencydictobject from the Asana task), andasana_task(which expects the Asana taskdictobject). The function should return aDataConnectioninstance. Defaults toNoneTip
The
connection_callbackargument is useful if you want to customize the connection styling based on properties included in the Asana task.series_kwargs (
dictorNone) – Collection of additional keyword arguments to use when instantiating theGanttSeries(besides thedataargument, which will be determined from the Asana tasks). Defaults toNone.
- Returns:
A
GanttSeriespopulated with data from the indicated Asana project/section.- Return type:
GanttSeries- Raises:
HighchartsDependencyError – if the monday Python library is not available in the runtime environment
MondayAuthenticationError – if there is no Monday.com API token supplied
HighchartsValueError – if both
templateandproperty_column_mapare empty
# Given a GanttSeries named "my_series" and an Monday.com Board ID of "123456"
my_series.load_from_monday(board_id = '123456')
Tip
Where to find my Monday.com Board ID?
Of course, you can find your Monday.com Board ID using the Monday.com API, but that is typically a bit cumbersome. The easiest way to find it is to simply grab it out of your browser’s URL bar:
Method Signature
See also
GanttSeries.from_monday()GanttData.from_monday()
- .load_from_monday(self, board_id, api_token=None, template=None, property_column_map=None, connection_kwargs=None, connection_callback=None)
Update the
GanttSeriesinstance with data from a Monday.com work board.- Parameters:
board_id (
int) –The ID of the Monday.com board whose items should be retrieved to populate the Gantt series.
Tip
You can find your Asana Project GID in your browser URL bar:
The Monday.com API token to use when authenticating your request against the Monday.com API. Defaults to
None, which will then try to determine the token from theMONDAY_API_TOKENenvironment variable.Warning
If no token is either passed to the method or found in the
MONDAY_API_TOKENenvironment variable, calling this method will raise an error.The name of a standard Mpnday.com board template supported by Highcharts for Python. If supplied, will override the
property_column_mapargument. Defaults toNone.Note
If
property_column_mapis set, thetemplateargument will be ignored and overridden byproperty_column_map.property_column_map (
dictorNone) –A
dictused to map Monday.com columns to their correspondingGanttSeriesproperties. Keys are expected to beGanttSeriesproperties, while values are expected to be Monday.com column field names. Defaults toNone.Note
If
property_column_mapis supplied, its settings override thetemplatesetting.connection_kwargs (
dictorNone) – Set of keyword arugments to supply to theDataConnectionconstructor, besides the.toproperty which is derived from the task. Defaults toNoneconnection_callback (Callable or
None) –A custom Python function or method which accepts two keyword arguments:
connection_target(which expects the dependencydictobject from the Asana task), andasana_task(which expects the Asana taskdictobject). The function should return aDataConnectioninstance. Defaults toNoneTip
The
connection_callbackargument is useful if you want to customize the connection styling based on properties included in the Asana task.
- Raises:
HighchartsDependencyError – if the monday Python library is not available in the runtime environment
MondayAuthenticationError – if there is no Monday.com API token supplied
HighchartsValueError – if both
templateandproperty_column_mapare empty
Note
The
.from_jira()method is available on theChartandGanttSeriesclasses, allowing you to either assemble a series or an entire chart from an Atlassian JIRA project using only one method call.
from highcharts_gantt.chart import Chart
from highcharts_gantt.options.series.gantt import GanttSeries

# Create a new GanttSeries instance from a JIRA project with key ABCD
# - note that this method will automatically read your JIRA authentication credentials
#   from HIGHCHARTS_JIRA_SERVER, HIGHCHARTS_JIRA_USERNAME, and HIGHCHARTS_JIRA_TOKEN
#   environment variables. You can also supply these parameters in keyword arguments
#   to the method call if you want.
my_series = GanttSeries.from_jira(project_key = 'ABCD')

# Create a new Chart instance from a Monday.com board ID 123456
# - note that this method will automatically read your JIRA authentication credentials
#   from HIGHCHARTS_JIRA_SERVER, HIGHCHARTS_JIRA_USERNAME, and HIGHCHARTS_JIRA_TOKEN
#   environment variables. You can also supply these parameters in keyword arguments
#   to the method call if you want.
my_chart = Chart.from_monday(project_key = 'ABCD')
Method Signature
See also
GanttData.from_jira()
- classmethod .from_jira(cls, project_key, server=None, jql=None, username=None, password_or_token=None, oauth_dict=None, client_kwargs=None, jira_client=None, connection_kwargs=None, connection_callback=None, series_kwargs=None)
Create a
GanttSeriesinstance from an Atlassian JIRA project.Note
Highcharts Gantt for Python can create a JIRA API client for you, authenticating using either the Basic Authentication or Access Token methods supported by the JIRA API. However, if you wish to use the more-involved OAuth2 handshake, you can do so yourself and either
- supply an
oauth_dictargument containing the OAuth2 configuration details, or
- supply an
supply a fully-authenticated
jira_client
The reason for this is because the OAuth2 handshake has various permutations involving redirects, token refreshes, etc. which are outside the scope of the Highcharts Gantt for Python library, and if you are integrating Highcharts Gantt for Python into a larger application you are likely already facilitating the OAuth2 dance in a fashion appropriate for your use case.
- Parameters:
project_key (
str) – The globally unique key of the Project whose tasks should be used to assemble the Gantt chart. For example,JRA.The URL of the JIRA instance from which data should be retrieved. Defaults to
None, which looks for a value in theHIGHCHARTS_JIRA_SERVERenvironment variable. If no value is found there, will then fallback to JIRA Cloud:'https://jira.atlasian.com'.Note
This argument will override the comparable setting in
client_kwargsifclient_kwargsis supplied.jql (
strorNone) – An optional JIRA Query Language query string to further narrow the issues returned from JIRA. Defaults toNone.The username to use when authenticating using either
basicortokenauthentication. Defaults toNone, which looks for a value in theHIGHCHARTS_JIRA_USERNAMEenvironment variable.Note
If
oauth2_dictis supplied, theusernameargument will be ignored since OAuth2 authentication will be used.password_or_token (
strorNone) –The password or access token to use when authenticating using either
basicortokenauthentication. Defaults toNone, which looks for a vlaue in theHIGHCHARTS_JIRA_TOKENenvironment variable.Note
If
oauth_dictis supplied, thepassword_or_tokenwill be ignored since OAuth2 authentication will be used.A
dictof key/value pairs providing configuration of the Oauth2 authentication details. Expected keys are:'access_token''access_token_secret''consumer_key''key_cert'
Defaults to
None.Note
To use OAuth2 authentication, an
oauth_dictmust be supplied. If you wish to force either basic or token authentication, make sure this argument remainsNone.client_kwargs (
dictorNone) – An optionaldictproviding keyword arguments to use when instantiating the JIRA client.jira_client (
jira.client.JIRAinstance that has been fully authenticated) – A fully-configured and fully-authenticated JIRA API client. Defaults toNone.connection_kwargs (
dictorNone) – Set of keyword arugments to supply to theDataConnectionconstructor, besides the.toproperty which is derived from the task. Defaults toNoneconnection_callback (Callable or
None) –A custom Python function or method which accepts two keyword arguments:
connection_target(which expects the dependencyIssueobject from the initialIssue), andissue(which expects the initialIssueobject). The function should return aDataConnectioninstance. Defaults toNone.Tip
The
connection_callbackargument is useful if you want to customize the connection styling based on properties included in the target issue.series_kwargs (
dictorNone) – Collection of additional keyword arguments to use when instantiating theGanttSeries(besides thedataargument, which will be determined from the JIRA issues). Defaults toNone.
- Returns:
A
GanttSeriespopulated with data from the indicated JIRA project.- Return type:
GanttSeries- Raises:
HighchartsDependencyError – if the jira Python library is not available in the runtime environment.
JIRAAuthenticationError – if no authentication details are provided or if the authentication process fails
JIRAProjectNotFoundError –
if the
project_keyis not found in the JIRAserverindicatedTip
This can happen if authentication fails silently, which can happen when using the JIRA Cloud environment.
HighchartsValueError – if other keyword arguments are misconfigured
# Given a GanttSeries named "my_series" and a JIRA project key of "ABCD"
my_series.load_from_jira(project_key = 'ABCD')
Method Signature
See also
GanttSeries.from_jira()GanttData.from_jira()
- .load_from_jira(self, project_key, server=None, jql=None, username=None, password_or_token=None, oauth_dict=None, client_kwargs=None, jira_client=None, connection_kwargs=None, connection_callback=None)
Update the
GanttSeriesinstance with data from an Atlassian JIRA project.Note
Highcharts Gantt for Python can create a JIRA API client for you, authenticating using either the Basic Authentication or Access Token methods supported by the JIRA API. However, if you wish to use the more-involved OAuth2 handshake, you can do so yourself and either
supply an
oauth_dictargument containing the OAuth2 configuration details, orsupply a fully-authenticated
jira_client
The reason for this is because the OAuth2 handshake has various permutations involving redirects, token refreshes, etc. which are outside the scope of the Highcharts Gantt for Python library, and if you are integrating Highcharts Gantt for Python into a larger application you are likely already facilitating the OAuth2 dance in a fashion appropriate for your use case.
- Parameters:
project_key (
str) – The globally unique key of the Project whose tasks should be used to assemble the Gantt chart. For example,JRA.The URL of the JIRA instance from which data should be retrieved. Defaults to
None, which looks for a value in theHIGHCHARTS_JIRA_SERVERenvironment variable. If no value is found there, will then fallback to JIRA Cloud:'https://jira.atlasian.com'.Note
This argument will override the comparable setting in
client_kwargsifclient_kwargsis supplied.jql (
strorNone) – An optional JIRA Query Language query string to further narrow the issues returned from JIRA. Defaults toNone.The username to use when authenticating using either
basicortokenauthentication. Defaults toNone, which looks for a value in theHIGHCHARTS_JIRA_USERNAMEenvironment variable.Note
If
oauth2_dictis supplied, theusernameargument will be ignored since OAuth2 authentication will be used.password_or_token (
strorNone) –The password or access token to use when authenticating using either
basicortokenauthentication. Defaults toNone, which looks for a vlaue in theHIGHCHARTS_JIRA_TOKENenvironment variable.Note
If
oauth_dictis supplied, thepassword_or_tokenwill be ignored since OAuth2 authentication will be used.A
dictof key/value pairs providing configuration of the Oauth2 authentication details. Expected keys are:'access_token''access_token_secret''consumer_key''key_cert'
Defaults to
None.Note
To use OAuth2 authentication, an
oauth_dictmust be supplied. If you wish to force either basic or token authentication, make sure this argument remainsNone.client_kwargs (
dictorNone) – An optionaldictproviding keyword arguments to use when instantiating the JIRA client.jira_client (
jira.client.JIRAinstance that has been fully authenticated) – A fully-configured and fully-authenticated JIRA API client. Defaults toNone.connection_kwargs (
dictorNone) – Set of keyword arugments to supply to theDataConnectionconstructor, besides the.toproperty which is derived from the task. Defaults toNoneconnection_callback (Callable or
None) –A custom Python function or method which accepts two keyword arguments:
connection_target(which expects the dependencyIssueobject from the initialIssue), andissue(which expects the initialIssueobject). The function should return aDataConnectioninstance. Defaults toNone.Tip
The
connection_callbackargument is useful if you want to customize the connection styling based on properties included in the target issue.
- Raises:
HighchartsDependencyError – if the jira Python library is not available in the runtime environment.
JIRAAuthenticationError – if no authentication details are provided or if the authentication process fails
JIRAProjectNotFoundError –
if the
project_keyis not found in the JIRAserverindicatedTip
This can happen if authentication fails silently, which can happen when using the JIRA Cloud environment.
HighchartsValueError – if other keyword arguments are misconfigured
my_series = LineSeries()

# A simple array of numerical values which correspond to the Y value of the data
# point
my_series.data = [0, 5, 3, 5]

# An array containing 2-member arrays (corresponding to the X and Y values of the
# data point)
my_series.data = [
    [0, 0],
    [1, 5],
    [2, 3],
    [3, 5]
]

# An array of dict with named values
my_series.data = [
  {
      'x': 0,
      'y': 0,
      'name': 'Point1',
      'color': '#00FF00'
  },
  {
      'x': 1,
      'y': 5,
      'name': 'Point2',
      'color': '#CCC'
  },
  {
      'x': 2,
      'y': 3,
      'name': 'Point3',
      'color': '#999'
  },
  {
      'x': 3,
      'y': 5,
      'name': 'Point4',
      'color': '#000'
  }
]
Warning
Technical indicators provided by
Highcharts Gantt for Python do not support the .data property because
their data gets populated dynamically based on the series indicated in their
.linked_to
property.
from highcharts_gantt.options.series.area import LineSeries
from highcharts_gantt.options.series.data import CartesianData

# A simple array of numerical values which correspond to the Y value of the data
# point
my_data = CartesianData.from_array([0, 5, 3, 5])

# An array containing 2-member arrays (corresponding to the X and Y values of the
# data point)
my_data = CartesianData.from_array([
    [0, 0],
    [1, 5],
    [2, 3],
    [3, 5]
])

# An array of dict with named values
my_data = CartesianData.from_array([
  {
      'x': 0,
      'y': 0,
      'name': 'Point1',
      'color': '#00FF00'
  },
  {
      'x': 1,
      'y': 5,
      'name': 'Point2',
      'color': '#CCC'
  },
  {
      'x': 2,
      'y': 3,
      'name': 'Point3',
      'color': '#999'
  },
  {
      'x': 3,
      'y': 5,
      'name': 'Point4',
      'color': '#000'
  }
])

my_series = LineSeries(data = my_data)
Method Signature
- classmethod from_array(cls, value)
Creates a collection of data point instances, parsing the contents of
valueas an array (iterable). This method is specifically used to parse data that is input to Highcharts for Python without property names, in an array-organized structure as described in the Highcharts JS documentation.See also
The specific structure of the expected array is highly dependent on the type of data point that the series needs, which itself is dependent on the series type itself.
Please review the detailed series documentation for series type-specific details of relevant array structures.
Note
An example of how this works for a simple
LineSeries(which usesCartesianDatadata points) would be:my_series = LineSeries() # A simple array of numerical values which correspond to the Y value of the data # point my_series.data = [0, 5, 3, 5] # An array containing 2-member arrays (corresponding to the X and Y values of the # data point) my_series.data = [ [0, 0], [1, 5], [2, 3], [3, 5] ] # An array of dict with named values my_series.data = [ { 'x': 0, 'y': 0, 'name': 'Point1', 'color': '#00FF00' }, { 'x': 1, 'y': 5, 'name': 'Point2', 'color': '#CCC' }, { 'x': 2, 'y': 3, 'name': 'Point3', 'color': '#999' }, { 'x': 3, 'y': 5, 'name': 'Point4', 'color': '#000' } ]
- Parameters:
value (iterable) –
The value that should contain the data which will be converted into data point instances.
Note
If
valueis not an iterable, it will be converted into an iterable to be further de-serialized correctly.- Returns:
Collection of data point instances (descended from
DataBase)- Return type:
Warning
Technical indicators provided by
Highcharts Gantt for Python do not support the .data property because
their data gets populated dynamically based on the series indicated in their
.linked_to
property.
from highcharts_gantt.chart import Chart
from highcharts_gantt.options.series.area import LineSeries

# Create a new LineSeries instance from the CSV file "some-csv-file.csv".
my_series = LineSeries.from_csv('some-csv-file.csv',
                                property_column_map = {
                                    'x': 0,
                                    'y': 3,
                                    'id': 'id'
                                })

# Create a new LineSeries instance from the CSV file "some-csv-file.csv".
my_chart = Chart.from_csv('some-csv-file.csv',
                          property_column_map = {
                              'x': 0,
                              'y': 3,
                              'id': 'id'
                          },
                          series_type = 'line')
Method Signature
See also
- classmethod .from_csv(cls, as_string_or_file, property_column_map, series_kwargs=None, has_header_row=True, delimiter=',', null_text='None', wrapper_character="'", line_terminator='\r\n', wrap_all_strings=False, double_wrapper_character_when_nested=False, escape_character='\\')
Create a new series instance with a
.dataproperty populated from data in a CSV string or file.Note
For an example
LineSeries, the minimum code required would be:my_series = LineSeries.from_csv('some-csv-file.csv', property_column_map = { 'x': 0, 'y': 3, 'id': 'id' })
As the example above shows, data is loaded into the
my_seriesinstance from the CSV file with a filenamesome-csv-file.csv. Thexvalues for each data point will be taken from the first (index 0) column in the CSV file. Theyvalues will be taken from the fourth (index 3) column in the CSV file. And theidvalues will be taken from a column whose header row is labeled'id'(regardless of its index).- Parameters:
as_string_or_file (
stror Path-like) –The CSV data to use to pouplate data. Accepts either the raw CSV data as a
stror a path to a file in the runtime environment that contains the CSV data.Tip
Unwrapped empty column values are automatically interpreted as null (
None).property_column_map (
dict) –A
dictused to indicate which data point property should be set to which CSV column. The keys in thedictshould correspond to properties in the data point class, while the value can either be a numerical index (starting with 0) or astrindicating the label for the CSV column.has_header_row (
bool) – IfTrue, indicates that the first row ofas_string_or_filecontains column labels, rather than actual data. Defaults toTrue.series_kwargs (
dict) –An optional
dictcontaining keyword arguments that should be used when instantiating the series instance. Defaults toNone.Warning
If
series_kwargscontains adatakey, its value will be overwritten. Thedatavalue will be created from the CSV file instead.delimiter (
str) – The delimiter used between columns. Defaults to,.wrapper_character (
str) – The string used to wrap string values when wrapping is applied. Defaults to'.null_text (
str) – The string used to indicate an empty value if empty values are wrapped. Defaults to None.line_terminator (
str) – The string used to indicate the end of a line/record in the CSV data. Defaults to'\r\n'.line_terminator –
The string used to indicate the end of a line/record in the CSV data. Defaults to
'\r\n'.Note
The Python
csvcurrently ignores theline_terminatorparameter and always applies'\r\n', by design. The Python docs say this may change in the future, so for future backwards compatibility we are including it here.wrap_all_strings (
bool) –If
True, indicates that the CSV file has all string data values wrapped in quotation marks. Defaults toFalse.double_wrapper_character_when_nested (
bool) – IfTrue, quote character is doubled when appearing within a string value. IfFalse, theescape_characteris used to prefix quotation marks. Defaults toFalse.escape_character (
str) – A one-character string that indicates the character used to escape quotation marks if they appear within a string value that is already wrapped in quotation marks. Defaults to\\(which is Python for'\', which is Python’s native escape character).
- Returns:
A series instance (descended from
SeriesBase) with its.dataproperty populated from the CSV data inas_string_or_file.- Return type:
listof series instances (descended fromSeriesBase)- Raises:
HighchartsCSVDeserializationError – if
property_column_mapreferences CSV columns by their label, but the CSV data does not contain a header row
# Given a LineSeries named "my_series", and a CSV file named "updated-data.csv"
my_series.load_from_csv('updated-data.csv',
                        property_column_map = {
                            'x': 0,
                            'y': 3,
                            'id': 'id'
                        })
Method Signature
- .load_from_csv(self, as_string_or_file, property_column_map, has_header_row=True, delimiter=',', null_text='None', wrapper_character="'", line_terminator='\r\n', wrap_all_strings=False, double_wrapper_character_when_nested=False, escape_character='\\')
Updates the series instance with a collection of data points (descending from
DataBase) fromas_string_or_fileby traversing the rows of data and extracting the values from the columns indicated inproperty_column_map.Warning
This method will overwrite the contents of the series instance’s
dataproperty.Note
For an example
LineSeries, the minimum code required would be:my_series = LineSeries() my_series.load_from_csv('some-csv-file.csv', property_column_map = { 'x': 0, 'y': 3, 'id': 'id' })
As the example above shows, data is loaded into the
my_seriesinstance from the CSV file with a filenamesome-csv-file.csv. Thexvalues for each data point will be taken from the first (index 0) column in the CSV file. Theyvalues will be taken from the fourth (index 3) column in the CSV file. And theidvalues will be taken from a column whose header row is labeled'id'(regardless of its index).- Parameters:
as_string_or_file (
stror Path-like) –The CSV data to load, either as a
stror as the name of a file in the runtime envirnoment. If a file, data will be read from the file.Tip
Unwrapped empty column values are automatically interpreted as null (
None).property_column_map (
dict) –A
dictused to indicate which data point property should be set to which CSV column. The keys in thedictshould correspond to properties in the data point class, while the value can either be a numerical index (starting with 0) or astrindicating the label for the CSV column.has_header_row (
bool) – IfTrue, indicates that the first row ofas_string_or_filecontains column labels, rather than actual data. Defaults toTrue.delimiter (
str) – The delimiter used between columns. Defaults to,.wrapper_character (
str) – The string used to wrap string values when wrapping is applied. Defaults to'.null_text (
str) – The string used to indicate an empty value if empty values are wrapped. Defaults to None.line_terminator (
str) –The string used to indicate the end of a line/record in the CSV data. Defaults to
'\r\n'.Warning
The Python
csvmodule currently ignores theline_terminatorparameter and always applies'\r\n', by design. The Python docs say this may change in the future, so for future backwards compatibility we are including it here.wrap_all_strings (
bool) –If
True, indicates that the CSV file has all string data values wrapped in quotation marks. Defaults toFalse.double_wrapper_character_when_nested (
bool) – IfTrue, quote character is doubled when appearing within a string value. IfFalse, theescape_characteris used to prefix quotation marks. Defaults toFalse.escape_character (
str) – A one-character string that indicates the character used to escape quotation marks if they appear within a string value that is already wrapped in quotation marks. Defaults to\\(which is Python for'\', which is Python’s native escape character).
- Returns:
A collection of data points descended from
DataBaseas appropriate for the series class.- Return type:
- Raises:
HighchartsDeserializationError – if unable to parse the CSV data correctly
# Given a Pandas DataFrame instance named "df"
from highcharts_gantt.chart import Chart
from highcharts_gantt.options.series.area import LineSeries

# Creating a Series from the DataFrame
my_series = LineSeries.from_pandas(df,
                                   property_map = {
                                       'x': 'date',
                                       'y': 'value',
                                       'id': 'id'
                                   })

# Creating a Chart with a lineSeries from the DataFrame.
my_chart = Chart.from_pandas(df,
                             property_map = {
                                 'x': 'date',
                                 'y': 'value',
                                 'id': 'id'
                             },
                             series_type = 'line')
Method Signature
See also
- classmethod .from_pandas(cls, df, property_map, series_kwargs=None)
Create a series instance whose
.dataproperty is populated from a pandasDataFrame.- Parameters:
df (
DataFrame) – TheDataFramefrom which data should be loaded.property_map (
dict) – Adictused to indicate which data point property should be set to which column indf. The keys in thedictshould correspond to properties in the data point class, while the value should indicate the label for theDataFramecolumn.series_kwargs (
dict) –An optional
dictcontaining keyword arguments that should be used when instantiating the series instance. Defaults toNone.Warning
If
series_kwargscontains adatakey, its value will be overwritten. Thedatavalue will be created fromdfinstead.
- Returns:
A series instance (descended from
SeriesBase) with its.dataproperty populated from the data indf.- Return type:
listof series instances (descended fromSeriesBase)- Raises:
HighchartsPandasDeserializationError – if
property_mapreferences a column that does not exist in the data frameHighchartsDependencyError – if pandas is not available in the runtime environment
# Given a LineSeries named "my_series", and a Pandas DataFrame variable named "df"
my_series.load_from_pandas(df,
                           property_map = {
                               'x': 'date',
                               'y': 'value',
                               'id': 'id'
                           })
Method Signature
- .load_from_pandas(self, df, property_map)
Replace the contents of the
.dataproperty with data points populated from a pandasDataFrame.- Parameters:
df (
DataFrame) – TheDataFramefrom which data should be loaded.property_map (
dict) – Adictused to indicate which data point property should be set to which column indf. The keys in thedictshould correspond to properties in the data point class, while the value should indicate the label for theDataFramecolumn.
- Raises:
HighchartsPandasDeserializationError – if
property_mapreferences a column that does not exist in the data frameHighchartsDependencyError – if pandas is not available in the runtime environment
# Given a PySpark DataFrame instance named "df"

from highcharts_gantt.chart import Chart
from highcharts_gantt.options.series.area import LineSeries

# Create a LineSeries from the PySpark DataFrame "df"
my_series = LineSeries.from_pyspark(df,
                                    property_map = {
                                        'x': 'date',
                                        'y': 'value',
                                        'id': 'id'
                                    })

# Create a new Chart witha LineSeries from the DataFrame "df"
my_chart = Chart.from_pyspark(df,
                              property_map = {
                                  'x': 'date',
                                  'y': 'value',
                                  'id': 'id'
                              },
                              series_type = 'line')
Method Signature
See also
- classmethod .from_pyspark(cls, df, property_map, series_kwargs=None)
Create a series instance whose
.dataproperty is populated from a PySparkDataFrame.- Parameters:
df (
DataFrame) – TheDataFramefrom which data should be loaded.property_map (
dict) – Adictused to indicate which data point property should be set to which column indf. The keys in thedictshould correspond to properties in the data point class, while the value should indicate the label for theDataFramecolumn.series_kwargs (
dict) –An optional
dictcontaining keyword arguments that should be used when instantiating the series instance. Defaults toNone.Warning
If
series_kwargscontains adatakey, its value will be overwritten. Thedatavalue will be created fromdfinstead.
- Returns:
A series instance (descended from
SeriesBase) with its.dataproperty populated from the data indf.- Return type:
listof series instances (descended fromSeriesBase)- Raises:
HighchartsPySparkDeserializationError – if
property_mapreferences a column that does not exist in the data frameif PySpark is not available in the runtime environment
# Given a LineSeries named "my_series", and a PySpark DataFrame variable named "df"
my_series.load_from_pyspark(df,
                            property_map = {
                                'x': 'date',
                                'y': 'value',
                                'id': 'id'
                            })
Method Signature
- .load_from_pyspark(self, df, property_map)
Replaces the contents of the
.dataproperty with values from a PySparkDataFrame.- Parameters:
df (
DataFrame) – TheDataFramefrom which data should be loaded.property_map (
dict) – Adictused to indicate which data point property should be set to which column indf. The keys in thedictshould correspond to properties in the data point class, while the value should indicate the label for theDataFramecolumn.
- Raises:
HighchartsPySparkDeserializationError – if
property_mapreferences a column that does not exist in the data frameif PySpark is not available in the runtime environment
Adding Technical Indicators
Note
All standard series (descending from
SeriesBase) have an
.add_indicator() method
which can be used to easily configure a new indicator tied to the series in
question.
# Given a series instance in the variable "my_series"

# Create a Chart instance
my_chart = Chart.from_series(my_series)

# Adds a new Simple Moving Average indicator to the chart, based off of the
# "my_series" series.

my_chart = my_series.add_indicator(my_chart, indicator_name = 'sma')
Method Signature
- .add_indicator(chart, indicator_name, indicator_kwargs=None)
- Parameters:
chart (
Chart) – The chart object in which the series is rendered and to which the indicator should be appended.indicator_name (
str) – The name of the indicator that should be added to the series and chart. For the list of supported indicators, please review the Indicator List.indicator_kwargs (
dictorNone) – Keyword arguments to apply when instantiating the new indicator series. Defaults toNone.
- Returns:
chartwith a new indicator series included in its list of configured series.- Return type:
# Given a series instance with ID "my-series-id" in the variable "my_series"

# Create a Chart instance from the series "my_series"
my_chart = Chart.from_series(my_series)

# Add a Simple Moving Average indicator to the series with the ID "my-series-id"
my_chart.add_indicator(indicator_name = 'sma',
                       series = 'my-series-id')

# Create a new Chart instance
my_chart2 = Chart(options = {})

# Add a Simple Moving Average indicator AND the series with the ID "my-series-id"
# to the chart in "my_chart2"
my_chart2.add_indicator(indicator_name = 'sma',
                        series = my_series)
Method Signature
- .add_indicator(indicator_name, series, indicator_kwargs=None)
Creates a
IndicatorSeriesBase(descendant) that calculates theindicator_nametechnical indicator for the series provided inseries, and adds it to the chart’s.options.series.- Parameters:
indicator_name (
str) – The name of the indicator that should be added to the series and chart. For the list of supported indicators, please review the Indicator List.series (
strorSeriesBase) – The series to which the indicator should be added. Accepts either a series’.idas astr, or aSeriesBase(descendant) instance.indicator_kwargs (
dictorNone) – Keyword arguments to apply when instantiating the new indicator series. Defaults toNone.
- Returns:
Nothing. It simply changes the composition of the chart instance’s series to now include a new series with the indicator.
Assembling Your Chart and Options
Note
.add_series()is supported by theChart,HighchartsGanttOptions, andHighchartsStockOptionsclasses
my_chart = Chart()

my_series = LineSeries()
my_chart.add_series(my_series)
Method Signature
- .add_series(self, *series)
Adds
seriesto theChart.options.seriesproperty.- Parameters:
series (
SeriesBaseor coercable) – One or more series instances (descended fromSeriesBase) or an instance (e.g.dict,str, etc.) coercable to one
Note
.from_series()is supported by theChart,HighchartsGanttOptions, andHighchartsStockOptionsclasses
my_series1 = LineSeries()
my_series2 = BarSeries()

my_chart = Chart.from_series(my_series1, my_series2, options = None)
Method Signature
- .from_series(cls, *series, kwargs=None)
Creates a new
Chartinstance populated withseries.- Parameters:
series (
SeriesBaseor coercable) – One or more series instances (descended fromSeriesBase) or an instance (e.g.dict,str, etc.) coercable to onekwargs (
dict) –Other properties to use as keyword arguments for the instance to be created.
Warning
If
kwargssets theoptions.seriesproperty, that setting will be overridden by the contents ofseries.
- Returns:
A new
Chartinstance- Return type:
from highcharts_gantt.chart import Chart
from highcharts_gantt.options.series.area import LineSeries
from highcharts_gantt.options.series.bar import BarSeries

# Create a Chart instance called "my_chart" with an empty set of options
my_chart = Chart(options = {})

# Create a couple Series instances
my_series1 = LineSeries()
my_series2 = BarSeries()

# Populate the options series list with the series you created.
my_chart.options.series = [my_series1, my_series2]

# Make a new one, and append it.
my_series3 = LineSeries()
my_chart.options.series.append(my_series3)
Rendering Your Visualizations
from highcharts_gantt.chart import Chart
from highcharts_gantt.options.series.gantt import GanttSeries

my_chart = Chart(container = 'target_div',
                 options = {
                     'series': [
                         GanttSeries(data = [
                             ...
                         ])
                     ]
                 },
                 variable_name = 'myChart',
                 is_gantt_chart = True)

as_js_literal = my_chart.to_js_literal()

# This will produce a string equivalent to:
#
# document.addEventListener('DOMContentLoaded', function() {
#   const myChart = Highcharts.ganttChart('target_div', {
#      series: {
#          type: 'gantt',
#          data: [
#            ...
#          ]
#      }
#   });
# });
from highcharts_gantt.chart import Chart
from highcharts_gantt.options.series.area import LineSeries

my_chart = Chart(container = 'target_div',
                 options = {
                     'series': [
                         LineSeries(data = [0, 5, 3, 5])
                     ]
                 },
                 variable_name = 'myChart')

as_js_literal = my_chart.to_js_literal()

# This will produce a string equivalent to:
#
# document.addEventListener('DOMContentLoaded', function() {
#   const myChart = Highcharts.chart('target_div', {
#      series: {
#          type: 'line',
#          data: [0, 5, 3, 5]
#      }
#   });
# });
from highcharts_gantt.chart import Chart
from highcharts_gantt.options.series.gantt import GanttSeries
from highcharts_gantt.global_options.shared_options import SharedGanttOptions

my_chart = Chart(container = 'target_div',
                 options = {
                     'series': [
                         GanttSeries(data = [ ... ])
                     ]
                 },
                 variable_name = 'myChart',
                 is_gantt_chart = True)

# Now this will render the contents of "my_chart" in your Jupyter Notebook
my_chart.display()

# You can also supply shared options to display to make sure that they are applied:
my_shared_options = SharedGanttOptions()

# Now this will render the contents of "my_chart" in your Jupyter Notebook, but applying
# your shared options
my_chart.display(global_options = my_shared_options)
Method Signature
- display(self, global_options=None)
Display the chart in Jupyter Labs or Jupyter Notebooks.
- Parameters:
global_options (
SharedOptionsorNone) – The shared options to use when rendering the chart. Defaults toNone- Raises:
HighchartsDependencyError – if ipython is not available in the runtime environment
Downloading a Rendered Highcharts Visualization
from highcharts_gantt.chart import Chart
from highcharts_gantt.options.series.gantt import GanttSeries

my_chart = Chart(container = 'target_div',
                 options = {
                     'series': [
                         GanttSeries(data = [ ... ])
                     ]
                 },
                 variable_name = 'myChart',
                 is_gantt_chart = True)

# Download a PNG version of the chart in memory within your Python code.
my_png_image = my_chart.download_chart(format = 'png')

# Download a PNG version of the chart and save it the file "/images/my-chart-file.png"
my_png_image = my_chart.download_chart(
    format = 'png',
    filename = '/images/my-chart-file.png'
)
Method Signature
- .download_chart(self, filename=None, format='png', server_instance=None, scale=1, width=None, auth_user=None, auth_password=None, timeout=0.5, global_options=None, **kwargs)
Export a downloaded form of the chart using a Highcharts Export Server.
- Parameters:
filename (Path-like or
None) – The name of the file where the exported chart should (optionally) be persisted. Defaults toNone.server_instance (
ExportServerorNone) – Provide an already-configuredExportServerinstance to use to programmatically produce the exported chart. Defaults toNone, which causes Highcharts for Python to instantiate a newExportServerinstance with all applicable defaults.format (
str) –The format in which the exported chart should be returned. Defaults to
'png'.Accepts:
'png''jpeg''pdf''svg'
scale (numeric) –
The scale factor by which the exported chart image should be scaled. Defaults to
1.Tip
Use this setting to improve resolution when exporting PNG or JPEG images. For example, setting
scale = 2on a chart whose width is 600px will produce an image file with a width of 1200px.Warning
If
widthis explicitly set, this setting will be overridden.width (numeric or
None) –The width that the exported chart should have. Defaults to
None.Warning
If explicitly set, this setting will override
scale.auth_user (
strorNone) – The username to use to authenticate against the Export Server, using basic authentication. Defaults toNone.auth_password (
strorNone) – The password to use to authenticate against the Export Server (using basic authentication). Defaults toNone.timeout (numeric or
None) – The number of seconds to wait before issuing a timeout error. The timeout check is passed if bytes have been received on the socket in less than thetimeoutvalue. Defaults to0.5.global_options (
HighchartsStockOptions,HighchartsOptionsorNone) – The global options which will be passed to the (JavaScript)Highcharts.setOptions()method, and which will be applied to the exported chart. Defaults toNone.
Note
All other keyword arguments are as per the
ExportServerconstructor.
from highcharts_gantt.chart import Chart
from highcharts_gantt.options.series.gantt import GanttSeries
from highcharts_gantt.headless_export import ExportServer

custom_server = ExportServer(url = 'https://www.mydomain.dev/some_pathname_goes_here')

my_chart = Chart(container = 'target_div',
                 options = {
                     'series': [
                         GanttSeries(data = [ ... ])
                     ]
                 },
                 variable_name = 'myChart',
                 is_gantt_chart = True)

# Download a PNG version of the chart in memory within your Python code.
my_png_image = my_chart.download_chart(format = 'png',
                                       server_instance = custom_server)

# Download a PNG version of the chart and save it the file "/images/my-chart-file.png"
my_png_image = my_chart.download_chart(
    format = 'png',
    filename = '/images/my-chart-file.png',
    server_instance = custom_server
)
Tip
Best practice!
If you are using a custom export server, it is strongly recommended that you
supply its configuration (e.g. the URL) via environment variables. For more information,
please see
headless_export.ExportServer.
Method Signature
- .download_chart(self, filename=None, format='png', server_instance=None, scale=1, width=None, auth_user=None, auth_password=None, timeout=0.5, global_options=None, **kwargs)
Export a downloaded form of the chart using a Highcharts Export Server.
- Parameters:
filename (Path-like or
None) – The name of the file where the exported chart should (optionally) be persisted. Defaults toNone.server_instance (
ExportServerorNone) – Provide an already-configuredExportServerinstance to use to programmatically produce the exported chart. Defaults toNone, which causes Highcharts for Python to instantiate a newExportServerinstance with all applicable defaults.format (
str) –The format in which the exported chart should be returned. Defaults to
'png'.Accepts:
'png''jpeg''pdf''svg'
scale (numeric) –
The scale factor by which the exported chart image should be scaled. Defaults to
1.Tip
Use this setting to improve resolution when exporting PNG or JPEG images. For example, setting
scale = 2on a chart whose width is 600px will produce an image file with a width of 1200px.Warning
If
widthis explicitly set, this setting will be overridden.width (numeric or
None) –The width that the exported chart should have. Defaults to
None.Warning
If explicitly set, this setting will override
scale.auth_user (
strorNone) – The username to use to authenticate against the Export Server, using basic authentication. Defaults toNone.auth_password (
strorNone) – The password to use to authenticate against the Export Server (using basic authentication). Defaults toNone.timeout (numeric or
None) – The number of seconds to wait before issuing a timeout error. The timeout check is passed if bytes have been received on the socket in less than thetimeoutvalue. Defaults to0.5.global_options (
HighchartsStockOptions,HighchartsOptionsorNone) – The global options which will be passed to the (JavaScript)Highcharts.setOptions()method, and which will be applied to the exported chart. Defaults toNone.
Note
All other keyword arguments are as per the
ExportServerconstructor.
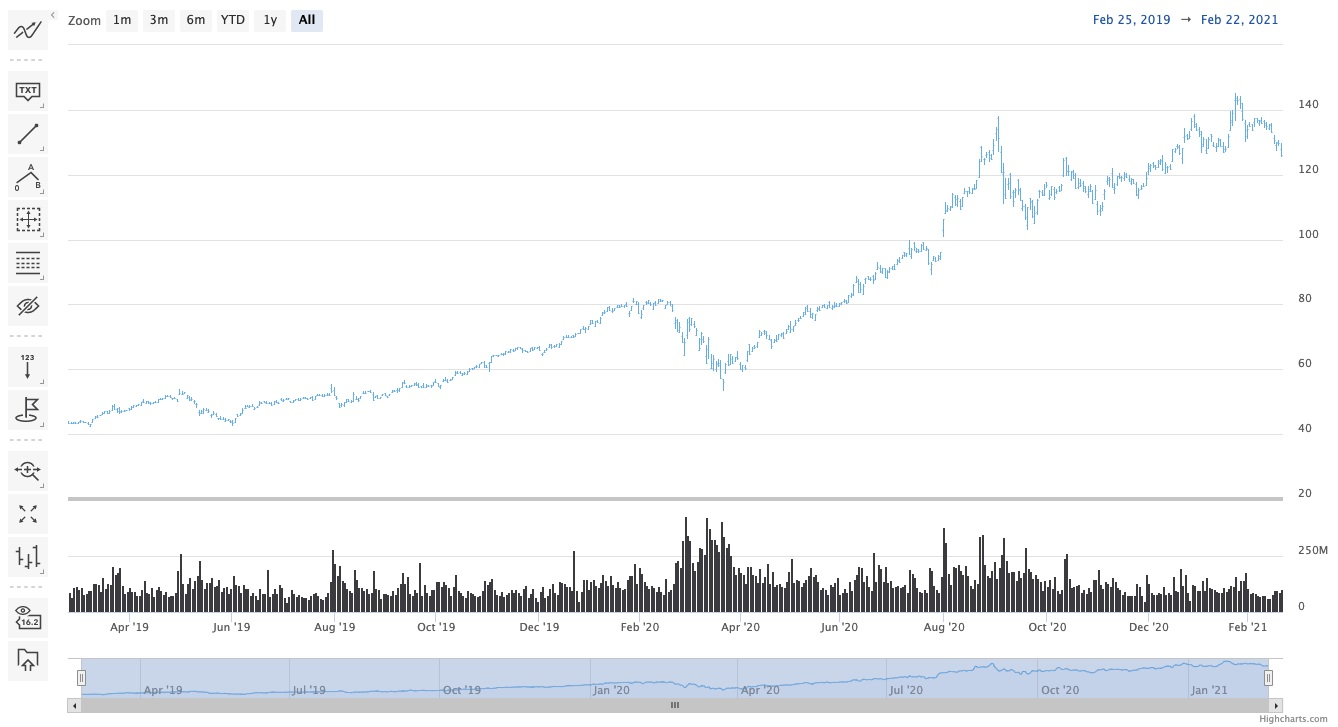
Using Highcharts Stock Features
Stock tools are a custom toolbar that can be displayed on your chart which allows your users to interact with your chart in various ways. Using event bindings tied to the stock tools, you can toggle annotations, toggle technical indicators, or control the chart’s zoom level.
To display the stock tools in your chart, you can use the
HighchartsGanttOptions.stock_tools
setting, which can be configured using a
StockTools instance.
my_stock_tools = StockTools(gui = { 'enabled': True })
my_options = HighchartsGanttOptions(stock_tools = my_stock_tools)
my_chart = Chart.from_options(my_options)
See also
The Navigator is a small series shown below the main series which displays a zoomed-out view of the entire dataset. It allows you to zoom in / out or jump to a particular range of time in the chart.
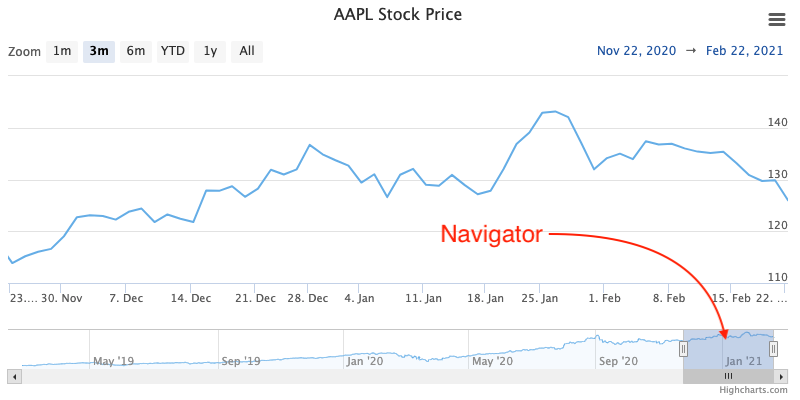
The navigator is enabled by default in Chart
instances where .is_stock_chart
is True or whose .options contain
a HighchartsStockOptions
instance.
You can configure how the navigator is rendered using several different methods:
You can configure whether individual series are shown in the navigator by setting their
.show_in_navigatorproperty toTrue(to show) orFalse(to hide)You can configure how the series is rendered within the navigator by setting their
.navigator_optionsproperty.You can set general navigator options for the series type by setting their
PlotOptions.<SERIES TYPE>.show_in_navigatorandPlotOptions.<SERIES TYPE>.navigator_optionsproperties.You can set overall configuration settings for the entire navigator using the
HighchartsStockOptions.navigatorsetting.
See also
The Range Selector is a small tool displayed above (or beside) the visualization which allows the user to pre-select the time range that is displayed on the chart.
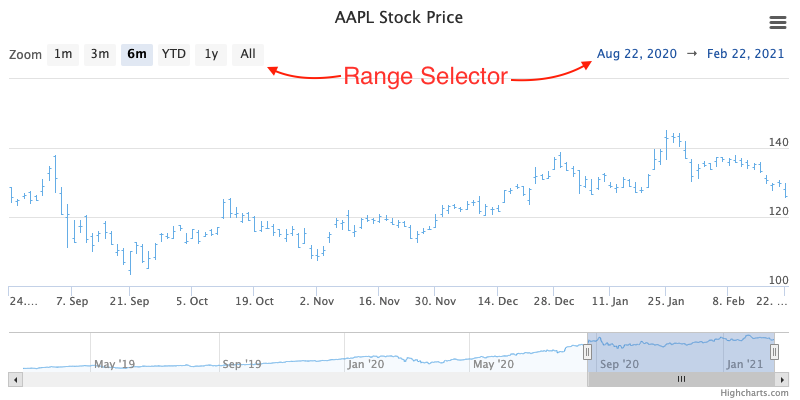
Based upon its configuration (via the
HighchartsGanttOptions.range_selector or HighchartsStockOptions.range_selector
properties), it can display a series of buttons that allow the user to zoom to a
specific granularity (e.g. display one day’s worth of data, display one week’s worth
of data, display one month’s worth of data, etc.) and can provide the user with inputs
to select the range (start date / end date) which should be displayed.
Note
By default, the range selector is rendered in a responsive fashion. If there is not
enough room to display the entire selector in a single row, it will collapse into a
dropdown configuration based on the
RangeSelector.dropdown
setting.
See also