.gauge
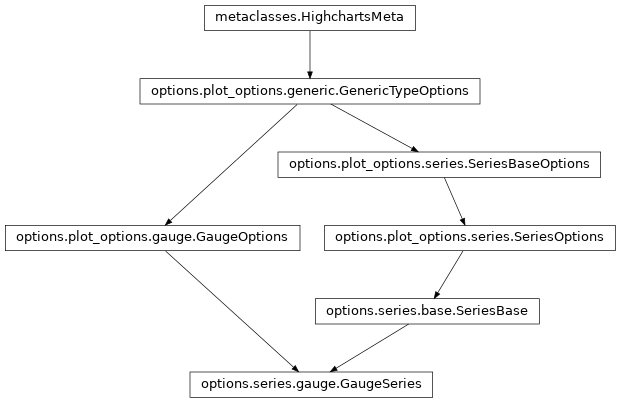
class: GaugeSeries
- class GaugeSeries(**kwargs)[source]
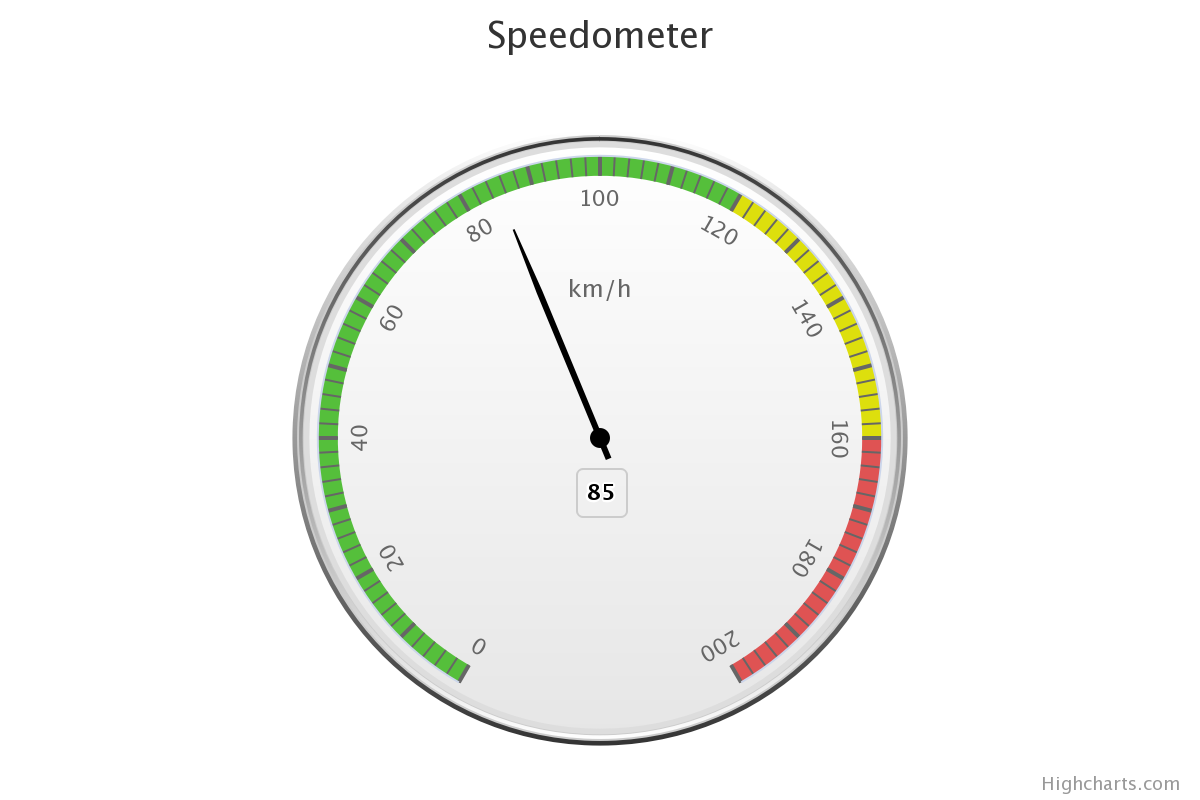
Options to configure a Gauge series.
Gauges are circular plots displaying one or more values with a dial pointing to values along the perimeter.
Class Inheritance
- copy(other=None, overwrite=True, **kwargs)
Copy the configuration settings from this instance to the
otherinstance.- Parameters:
other (
HighchartsMeta) – The target instance to which the properties of this instance should be copied. IfNone, will create a new instance and populate it with properties copied fromself. Defaults toNone.overwrite (
bool) – ifTrue, properties inotherthat are already set will be overwritten by their counterparts inself. Defaults toTrue.kwargs – Additional keyword arguments. Some special descendents of
HighchartsMetamay have special implementations of this method which rely on additional keyword arguments.
- Returns:
A mutated version of
otherwith new property values
- classmethod from_csv(as_string_or_file, property_column_map, has_header_row=True, series_kwargs=None, delimiter=',', null_text='None', wrapper_character="'", line_terminator='\r\n', wrap_all_strings=False, double_wrapper_character_when_nested=False, escape_character='\\')
Create a new series instance with a
.dataproperty populated from data in a CSV string or file.Note
For an example
LineSeries, the minimum code required would be:my_series = LineSeries.from_csv('some-csv-file.csv', property_column_map = { 'x': 0, 'y': 3, 'id': 'id' })
As the example above shows, data is loaded into the
my_seriesinstance from the CSV file with a filenamesome-csv-file.csv. Thexvalues for each data point will be taken from the first (index 0) column in the CSV file. Theyvalues will be taken from the fourth (index 3) column in the CSV file. And theidvalues will be taken from a column whose header row is labeled'id'(regardless of its index).- Parameters:
as_string_or_file (
stror Path-like) –The CSV data to use to pouplate data. Accepts either the raw CSV data as a
stror a path to a file in the runtime environment that contains the CSV data.Tip
Unwrapped empty column values are automatically interpreted as null (
None).property_column_map (
dict) –A
dictused to indicate which data point property should be set to which CSV column. The keys in thedictshould correspond to properties in the data point class, while the value can either be a numerical index (starting with 0) or astrindicating the label for the CSV column.has_header_row (
bool) – IfTrue, indicates that the first row ofas_string_or_filecontains column labels, rather than actual data. Defaults toTrue.series_kwargs (
dict) –An optional
dictcontaining keyword arguments that should be used when instantiating the series instance. Defaults toNone.Warning
If
series_kwargscontains adatakey, its value will be overwritten. Thedatavalue will be created from the CSV file instead.delimiter (
str) – The delimiter used between columns. Defaults to,.wrapper_character (
str) – The string used to wrap string values when wrapping is applied. Defaults to'.null_text (
str) – The string used to indicate an empty value if empty values are wrapped. Defaults to None.line_terminator (
str) – The string used to indicate the end of a line/record in the CSV data. Defaults to'\r\n'.line_terminator –
The string used to indicate the end of a line/record in the CSV data. Defaults to
'\r\n'.Note
The Python
csvcurrently ignores theline_terminatorparameter and always applies'\r\n', by design. The Python docs say this may change in the future, so for future backwards compatibility we are including it here.wrap_all_strings (
bool) –If
True, indicates that the CSV file has all string data values wrapped in quotation marks. Defaults toFalse.double_wrapper_character_when_nested (
bool) – IfTrue, quote character is doubled when appearing within a string value. IfFalse, theescape_characteris used to prefix quotation marks. Defaults toFalse.escape_character (
str) – A one-character string that indicates the character used to escape quotation marks if they appear within a string value that is already wrapped in quotation marks. Defaults to\\(which is Python for'\', which is Python’s native escape character).
- Returns:
A series instance (descended from
SeriesBase) with its.dataproperty populated from the CSV data inas_string_or_file.- Return type:
listof series instances (descended fromSeriesBase)- Raises:
HighchartsCSVDeserializationError – if
property_column_mapreferences CSV columns by their label, but the CSV data does not contain a header row
- classmethod from_dict(as_dict: dict, allow_snake_case: bool = True)
Construct an instance of the class from a
dictobject.
- classmethod from_js_literal(as_str_or_file, allow_snake_case: bool = True, _break_loop_on_failure: bool = False)
Return a Python object representation of a Highcharts JavaScript object literal.
- Parameters:
as_str_or_file (
str) – The JavaScript object literal, represented either as astror as a filename which contains the JS object literal.allow_snake_case (
bool) – IfTrue, interpretssnake_casekeys as equivalent tocamelCasekeys. Defaults toTrue._break_loop_on_failure (
bool) – IfTrue, will break any looping operations in the event of a failure. Otherwise, will attempt to repair the failure. Defaults toFalse.
- Returns:
A Python object representation of the Highcharts JavaScript object literal.
- Return type:
HighchartsMeta
- classmethod from_json(as_json_or_file, allow_snake_case: bool = True)
Construct an instance of the class from a JSON string.
- Parameters:
as_json_or_file – The JSON string for the object or the filename of a file that contains the JSON string.
allow_snake_case (
bool) – IfTrue, interpretssnake_casekeys as equivalent tocamelCasekeys. Defaults toTrue.
- Returns:
A Python objcet representation of
as_json.- Return type:
HighchartsMeta
- classmethod from_pandas(df, property_map, series_kwargs=None)
Create a series instance whose
.dataproperty is populated from a pandasDataFrame.- Parameters:
df (
DataFrame) – TheDataFramefrom which data should be loaded.property_map (
dict) – Adictused to indicate which data point property should be set to which column indf. The keys in thedictshould correspond to properties in the data point class, while the value should indicate the label for theDataFramecolumn.series_kwargs (
dict) –An optional
dictcontaining keyword arguments that should be used when instantiating the series instance. Defaults toNone.Warning
If
series_kwargscontains adatakey, its value will be overwritten. Thedatavalue will be created fromdfinstead.
- Returns:
A series instance (descended from
SeriesBase) with its.dataproperty populated from the data indf.- Return type:
listof series instances (descended fromSeriesBase)- Raises:
HighchartsPandasDeserializationError – if
property_mapreferences a column that does not exist in the data frameif pandas is not available in the runtime environment
- classmethod from_pyspark(df, property_map, series_kwargs=None)
Create a series instance whose
.dataproperty is populated from a PySparkDataFrame.- Parameters:
df (
DataFrame) – TheDataFramefrom which data should be loaded.property_map (
dict) – Adictused to indicate which data point property should be set to which column indf. The keys in thedictshould correspond to properties in the data point class, while the value should indicate the label for theDataFramecolumn.series_kwargs (
dict) –An optional
dictcontaining keyword arguments that should be used when instantiating the series instance. Defaults toNone.Warning
If
series_kwargscontains adatakey, its value will be overwritten. Thedatavalue will be created fromdfinstead.
- Returns:
A series instance (descended from
SeriesBase) with its.dataproperty populated from the data indf.- Return type:
listof series instances (descended fromSeriesBase)- Raises:
HighchartsPySparkDeserializationError – if
property_mapreferences a column that does not exist in the data frameif PySpark is not available in the runtime environment
- load_from_csv(as_string_or_file, property_column_map, has_header_row=True, delimiter=',', null_text='None', wrapper_character="'", line_terminator='\r\n', wrap_all_strings=False, double_wrapper_character_when_nested=False, escape_character='\\')
Replace the existing
.dataproperty with a new value populated from data in a CSV string or file.Note
For an example
LineSeries, the minimum code required would be:my_series = LineSeries() my_series = my_series.from_csv('some-csv-file.csv', property_column_map = { 'x': 0, 'y': 3, 'id': 'id' })
As the example above shows, data is loaded into the
my_seriesinstance from the CSV file with a filenamesome-csv-file.csv. Thexvalues for each data point will be taken from the first (index 0) column in the CSV file. Theyvalues will be taken from the fourth (index 3) column in the CSV file. And theidvalues will be taken from a column whose header row is labeled'id'(regardless of its index).- Parameters:
as_string_or_file (
stror Path-like) –The CSV data to use to pouplate data. Accepts either the raw CSV data as a
stror a path to a file in the runtime environment that contains the CSV data.Tip
Unwrapped empty column values are automatically interpreted as null (
None).property_column_map (
dict) –A
dictused to indicate which data point property should be set to which CSV column. The keys in thedictshould correspond to properties in the data point class, while the value can either be a numerical index (starting with 0) or astrindicating the label for the CSV column.has_header_row (
bool) – IfTrue, indicates that the first row ofas_string_or_filecontains column labels, rather than actual data. Defaults toTrue.delimiter (
str) – The delimiter used between columns. Defaults to,.wrapper_character (
str) – The string used to wrap string values when wrapping is applied. Defaults to'.null_text (
str) – The string used to indicate an empty value if empty values are wrapped. Defaults to None.line_terminator (
str) – The string used to indicate the end of a line/record in the CSV data. Defaults to'\r\n'.line_terminator –
The string used to indicate the end of a line/record in the CSV data. Defaults to
'\r\n'.Note
The Python
csvcurrently ignores theline_terminatorparameter and always applies'\r\n', by design. The Python docs say this may change in the future, so for future backwards compatibility we are including it here.wrap_all_strings (
bool) –If
True, indicates that the CSV file has all string data values wrapped in quotation marks. Defaults toFalse.double_wrapper_character_when_nested (
bool) – IfTrue, quote character is doubled when appearing within a string value. IfFalse, theescape_characteris used to prefix quotation marks. Defaults toFalse.escape_character (
str) – A one-character string that indicates the character used to escape quotation marks if they appear within a string value that is already wrapped in quotation marks. Defaults to\(which is Python for'', which is Python’s native escape character).
- Raises:
HighchartsCSVDeserializationError – if
property_column_mapreferences CSV columns by their label, but the CSV data does not contain a header row
- load_from_pandas(df, property_map)
Replace the contents of the
.dataproperty with data points populated from a pandasDataFrame.- Parameters:
df (
DataFrame) – TheDataFramefrom which data should be loaded.property_map (
dict) – Adictused to indicate which data point property should be set to which column indf. The keys in thedictshould correspond to properties in the data point class, while the value should indicate the label for theDataFramecolumn.
- Raises:
HighchartsPandasDeserializationError – if
property_mapreferences a column that does not exist in the data frameif pandas is not available in the runtime environment
- load_from_pyspark(df, property_map)
Replaces the contents of the
.dataproperty with values from a PySparkDataFrame.- Parameters:
df (
DataFrame) – TheDataFramefrom which data should be loaded.property_map (
dict) – Adictused to indicate which data point property should be set to which column indf. The keys in thedictshould correspond to properties in the data point class, while the value should indicate the label for theDataFramecolumn.
- Raises:
HighchartsPySparkDeserializationError – if
property_mapreferences a column that does not exist in the data frameif PySpark is not available in the runtime environment
- to_dict() dict
Generate a
dictrepresentation of the object compatible with the Highcharts JavaScript library.Note
The
dictrepresentation has a property structure and naming convention that is intentionally consistent with the Highcharts JavaScript library. This is not Pythonic, but it makes managing the interplay between the two languages much, much simpler.
- to_js_literal(filename=None, encoding='utf-8') str | None
Return the object represented as a
strcontaining the JavaScript object literal.
- to_json(filename=None, encoding='utf-8')
Generate a JSON string/byte string representation of the object compatible with the Highcharts JavaScript library.
Note
This method will either return a standard
stror abytesobject depending on the JSON serialization library you are using. For example, if your environment has orjson, the result will be abytesrepresentation of the string.- Parameters:
- Returns:
A JSON representation of the object compatible with the Highcharts library.
- Return type:
- static trim_dict(untrimmed: dict, to_json: bool = False) dict
Remove keys from
untrimmedwhose values areNoneand convert values that have.to_dict()methods.
- static trim_iterable(untrimmed, to_json=False)
Convert any
EnforcedNullTypevalues inuntrimmedto'null'.
- property accessibility: TypeOptionsAccessibility | None
Accessibility options for a series.
- Return type:
TypeOptionsAccessibilityorNone
- property allow_point_select: bool | None
Allow this series’ points to be selected by clicking on the graphic (columns, point markers, pie slices, map areas etc).
The selected points can be handled in JavaScript by point select and unselect events, or collectively by the (JavaScript)
getSelectedPoints()function.And alternative way of selecting points is through dragging.
Defaults to
False.
- property animation: AnimationOptions | None
Enable or disable the initial animation when a series is displayed.
The animation can also be set as a configuration object. Please note that this option only applies to the initial animation of the series itself. For other animations, see
Chart.animationand theanimationparameter under the (JavaScript) API methods. The following properties are supported:defer: The animation delay time in milliseconds.duration: The duration of the animation in milliseconds.easing: Can be a string reference to an easing function set on the Math object or a function.
Warning
Due to poor performance, animation is disabled in old IE browsers for several chart types.
- Return type:
AnimationOptionsorNone
- property animation_limit: int | float | Decimal | None
For some series, there is a limit that shuts down initial animation by default when the total number of points in the chart is too high. Defaults to
None.For example, for a column chart and its derivatives, animation does not run if there is more than 250 points totally. To disable this cap, set
animation_limittofloat("inf")(which represents infinity).- Return type:
numeric or
None
- property boost_threshold: int | None
Set the point threshold for when a series should enter boost mode. Defaults to
5000.Setting it to e.g. 2000 will cause the series to enter boost mode when there are 2,000 or more points in the series.
To disable boosting on the series, set the
boost_thresholdto0. Setting it to1will force boosting.Note
The
AreaOptions.crop_threshold()also affects this setting.When zooming in on a series that has fewer points than the
crop_threshold, all points are rendered although outside the visible plot area, and theboost_thresholdwon’t take effect.
- property class_name: str | None
The additional CSS class name to apply to the series’ graphical elements.
Note
This option is additive to the default class names - it does not replace them.
- property clip: bool | None
If
False, allows the series to be rendered in the entire plot area. IfTrue, constrains where the series can be rendered within the plot area. Defaults toTrue.
- property color: str | Gradient | Pattern | None
The main color of the series.
In line type series it applies to the line and the point markers unless otherwise specified. In bar type series it applies to the bars unless a color is specified per point. The default value is pulled from the
Options.colors()array.
- property color_axis: str | int | bool | None
When using dual or multiple color axes, this setting defines which color axis the particular series is connected to. It refers to either the
ColorAxis.id()or the index of the axis in theColorAxisarray, with0being the first. Set this option toFalseto prevent a series from connecting to the default color axis.Defaults to
0.
- property color_index: int | None
When operating in styled mode, a specific color index to use for the series, so that its graphic representations are given the class name
highcharts-color-{n}.Defaults to
None.
- property color_key: str | None
Determines what data value should be used to calculate point color if
AreaOptions.color_axis()is used.Note
Requires to set
minandmaxif some custom point property is used or if approximation for data grouping is set to'sum'.
- property connect_ends: bool | None
If
True, connect the ends of a line series plot across the extremes. Defaults toNone.Warning
Applies to polar charts only.
- property connect_nulls: bool | None
If
True, connect a graph line across null points. IfFalse, renders a gap between the points on either side of the null point. Defaults toFalse.
- property crisp: bool | None
If
True, each point or column edge is rounded to its nearest pixel in order to render sharp on screen. Defaults toTrue.Hint
In some cases, when there are a lot of densely packed columns, this leads to visible difference in column widths or distance between columns. In these cases, setting
crisptoFalsemay look better, even though each column is rendered blurry.
- property crop_threshold: int | None
When the series contains less points than the crop threshold, all points are drawn, even if the points fall outside the visible plot area at the current zoom. Defaults to
300.The advantage of drawing all points (including markers and columns), is that animation is performed on updates. On the other hand, when the series contains more points than the crop threshold, the series data is cropped to only contain points that fall within the plot area. The advantage of cropping away invisible points is to increase performance on large series.
- property cursor: str | None
The style of cursor to use when the user’s mouse hovers over the data series.
Acceptable values are:
'alias''all-scroll''auto''cell''col-resize''context-menu''copy''crosshair''default''e-resize''ew-resize''grab''grabbing''help''move''n-resize''ne-resize''nesw-resize''no-drop''none''not-allowed''ns-resize''nw-resize''nwse-resize''pointer''progress''row-resize''s-resize''se-resize''sw-resize''text''vertical-text''w-resize''wait''zoom-in''zoom-out'
- property custom: JavaScriptDict | None
A reserved subspace to store options and values for customized functionality.
Here you can add additional data for your own event callbacks and formatter callbacks.
- property dash_style: str | None
Name of the dash style to use for the graph, or for some series types the outline of each shape.
Accepts one of the following values:
‘Dash’,
‘DashDot’,
‘Dot’,
‘LongDash’,
‘LongDashDot’,
‘LongDashDotDot’,
‘ShortDash’,
‘ShortDashDot’,
‘ShortDashDotDot’,
‘ShortDot’,
‘Solid’
- property data: List[SinglePointData] | None
Collection of data that represents the series. Defaults to
None.While the series type returns a collection of
SinglePointDatainstances, it accepts as input three different types of data:series = PieSeries() series.data = [0, 5, 3, 5]
A one-dimensional collection of numerical values. Each member of the collection will be interpreted as a
yvalueA one-dimensional collection of
SinglePointDataobjects.
- property data_labels: DataLabel | List[DataLabel] | None
Options for the series data labels, appearing next to each data point.
Note
To have multiple data labels per data point, you can also supply a collection of
DataLabelconfiguration settings.
- property data_sorting: DataSorting | None
Options for the series data sorting.
- Return type:
DataSortingorNone
- property description: str | None
A description of the series to add to the screen reader information about the series.
- property dial: DialOptions | None
Options for the dial or arrow pointer of the gauge.
- Return type:
DialOptionsorNone
- property drag_drop: DragDropOptions | None
The draggable-points module allows points to be moved around or modified in the chart.
In addition to the options mentioned under the dragDrop API structure, the module fires three (JavaScript) events:
point.dragStartpoint.dragpoint.drop
- Return type:
DragDropOptionsorNone
- property enable_mouse_tracking: bool | None
If
True, enables mouse tracking for the series (used to capture point tooltips, click events on graphs and points, etc.). IfFalse, disables mouse tracking for the series (which can help performance). Defaults toTrue.
- property events: SeriesEvents | None
General event handlers for the series items.
Note
These event hooks can also be attached to the series at run time using the (JavaScript)
Highcharts.addEvent()function.- Return type:
SeriesEventsorNone
- property find_nearest_point_by: str | None
Determines whether the series should look for the nearest point in both dimensions or just the x-dimension when hovering the series.
If
None, defaults to'xy'for scatter series and'x'for most other series. If the data has duplicate x-values, it is recommended to set this to'xy'to allow hovering over all points.Applies only to series types using nearest neighbor search (not direct hover) for tooltip.
- property get_extremes_from_all: bool | None
If
True, uses the Y extremes of the total chart width or only the zoomed area when zooming in on parts of the X axis. By default, the Y axis adjusts to the min and max of the visible data.Warning
Applies to Cartesian series only.
- property id: str | None
An id for the series. Defaults to
None.Hint
This can be used (in JavaScript) after render time to get a pointer to the series object through
chart.get().
- property include_in_data_export: bool | None
If
False, will prevent the data series from being included in any form of data export. Defaults toTrue.
- property index: int | None
The index for the series in the chart, affecting the internal index in the (JavaScript)
chart.seriesarray, the visible Z-index, and the order of the series in the legend. Defaults toNone.
- property keys: List[str] | None
An array specifying which option maps to which key in the data point array.
This makes it convenient to work with unstructured data arrays from different sources.
- property label: SeriesLabel | None
Series labels are placed as close to the series as possible in a natural way, seeking to avoid other series. The goal of this feature is to make the chart more easily readable, like if a human designer placed the labels in the optimal position.
Note
The series labels currently work with series types having a graph or an area.
- Return type:
SeriesLabelorNone
- property legend_index: int | None
The sequential index for the series in the legend. Defaults to
None.
- property line_width: int | float | Decimal | None
Pixel width of the graph line. Defaults to
2.- Return type:
numeric or
None
- property linecap: str | None
The SVG value used for the
stroke-linecapandstroke-linejoinof a line graph. Defaults to'round', which means that lines are rounded in the ends and bends.
- property linked_to: str | None
The id of another series to link to.
Hint
The value can be
':previous'to link to the previous series. When two series are linked, only the first one appears in the legend. Toggling the visibility of this also toggles the linked series.Note
If the master series uses data sorting and linked series does not have its own sorting definition, the linked series will be sorted in the same order as the master one.
- property marker: Marker | None
Options for the point markers of line-like series.
Properties like
fill_color,line_colorandline_widthdefine the visual appearance of the markers. Other series types, like column series, don’t have markers, but have visual options on the series level instead.- Return type:
MarkerorNone
- property name: str | None
The name of the series as shown in the legend, tooltip, etc. Defaults to
None.
- property negative_color: str | Gradient | Pattern | None
The color for the parts of the graph or points that are below the
AreaOptions.threshold().Note
Zonestake precedence over the negative color. Usingnegative_coloris equivalent to applying a zone with value of 0.
- property on_point: OnPointOptions | None
Options for the Series on point feature, which is currently only supported by
pieandsunburstchargs.- Return type:
OnPointOptionsorNone
- property opacity: float | None
Opacity of a series parts: line, fill (e.g. area), and labels.
- Return type:
- property overshoot: int | float | Decimal | None
Allow the dial to overshoot the end of the perimeter axis by this many degrees.
For example, if this option is set to
5and the gauge axis goes from0to60, a value of100, or1000, will show5degrees beyond the end of the axis.Defaults to
None.- Return type:
numeric or
None
- property pivot: PivotOptions | None
Options for the pivot or the center point of the gauge.
- Return type:
PivotOptionsorNone
- property point_description_formatter: CallbackFunction | None
Same as for
Accessibility.series.description_formatter(), only for an individual series. Overrides the chart-wide configuration.- Return type:
CallbackFunctionorNone
- property point_interval: int | float | Decimal | None
If no x values are given for the points in a series,
point_intervaldefines the interval of the x values. Defaults to1.For example, if a series contains one value every decade starting from year 0, set
point_intervalto10. In true datetime axes, thepoint_intervalis set in milliseconds.Hint
point_intervalcan be also be combined withpoint_interval_unitto draw irregular time intervals.Note
If combined with
relative_x_value, an x value can be set on each point, and thepoint_intervalis added x times to thepoint_startsetting.Warning
This options applies to the series data, not the interval of the axis ticks, which is independent.
- Return type:
numeric or
None
- property point_interval_unit: str | None
On datetime series, this allows for setting the
point_intervalto irregular time units, day, month, and year.A day is usually the same as 24 hours, but
point_interval_unitalso takes the DST crossover into consideration when dealing with local time.Combine this option with
point_intervalto draw weeks, quarters, 6 month periods, 10 year periods, etc.Warning
This options applies to the series data, not the interval of the axis ticks, which is independent.
- property point_placement: str | int | float | Decimal | None
Used to determine the placement of the point in relation to tick marks on the X axis. Defaults to
None, which behaves as undefined in cartesian charts, and"between"in polar charts.Accepts possible values:
'on'- where the point will not create any padding of the X axis. In a polar column chart this means that the first column points directly north."between"- where the columns will be laid out between ticks. This is useful for example for visualising an amount between two points in time or in a certain sector of a polar chart.a numeric value - where
0is on the axis value,-0.5is between this value and the previous, and0.5is between this value and the next. Unlike the textual options, numeric point placement options won’t affect axis padding.
Warning
Requires
point_rangeto work. For column series this is computed, but for line-type series it needs to be set.Note
For the xrange series type and gantt charts, if the Y axis is a category axis, the
point_placementapplies to the Y axis rather than the (typically datetime) X axis.
- property point_start: int | float | Decimal | None
If no x values are given for the points in a series,
point_startdefines on what value to start. For example, if a series contains one yearly value starting from 1945, setpoint_startto1945. Defaults to0.Note
If combined with
relative_x_value, an x value can be set on each point. The x value from the point options is multiplied bypoint_intervaland added topoint_startto produce a modified x value.- Return type:
numeric or
None
- property relative_x_value: bool | None
When
True, X values in the data set are relative to the currentpoint_start,point_interval, andpoint_interval_unitsettings. This allows compression of the data for datasets with irregular X values. Defaults toFalse.The real X values are computed on the formula
f(x) = ax + b, whereais thepoint_interval(optionally with a time unit given bypoint_interval_unit), andbis thepoint_start.
- property selected: bool | None
If
True, the series is selected initially (by default, without user interaction). Defaults toFalse.Note
If
GenericTypeOptions.show_checkbox()isTrue, then the checkbox will be checked ifselectedisTrue.
- property shadow: bool | ShadowOptions | None
Configuration for the shadow to apply to the tooltip. Defaults to
False.If
False, no shadow is applied.- Returns:
The shadow configuration to apply or a boolean setting which hides the shadow or displays the default shadow.
- Return type:
boolorShadowOptions
- property show_checkbox: bool | None
If
True, a checkbox is displayed next to the legend item to allow selecting the series.Note
The state of the checkbox is controlled by the
GenericTypeOptions.selected()property.
- property show_in_legend: bool | None
Whether to display this particular series or series type in the legend. Standalone series are shown in the legend by default, and linked series are not.
If
True, the accessibility module will skip past this series when executing keyboard navigation.
- property soft_threshold: bool | None
When
True, the series will not cause the Y axis to cross the zero plane (or threshold option) unless the data actually crosses the plane. Defaults toTrue.For example, if
False, a series of0, 1, 2, 3will make the Y axis show negative values according to themin_padidngoption. IfTrue, the Y axis starts at 0.- Return type:
- property stack: str | None
Indicates the “stack” into which the series should be grouped, if the chart groups series into stacks. Defaults to
None.Note
The value can be a string or a numeric value, provided that series in the same stack all have the same value when converted to a string. For ease of ues, Highcharts for Python will attempt to force the conversion of the relevant value to a string.
- property stacking: str | None
Whether to stack the values of each series on top of each other. Defaults to
None.Acceptable values are:
Noneto disable stacking,"normal"to stack by value or"percent"'stream'(for streamgraph series type only)'overlap'(for waterfall series type only)
Note
When stacking is enabled, data must be sorted in ascending X order.
- property states: States | None
Configuration for state-specific configuration to apply to the data series.
- Return type:
StatesorNone
- property step: str | None
Whether to apply steps to the line. Defaults to
None.Possible values are:
'left''center''right'
- property sticky_tracking: bool | None
Sticky tracking of mouse events.
When
True, the (JavaScript)mouseOutevent on a series is not triggered until the mouse moves over another series, or out of the plot area.When
False, the (JavaScript)mouseOutevent on a series is triggered when the mouse leaves the area around the series’ graph or markers. This also implies the tooltip when not shared.When
FalseandPlotOptions.tooltip.shared()is alsoFalse, the tooltip will be hidden when moving the mouse between series.Defaults to
Truefor line and area type series, but toFalsefor columns, pies, etc.Note
The boost module will force this option because of technical limitations.
- property threshold: int | float | Decimal | EnforcedNullType | None
The Y axis value to serve as the base for the columns, for distinguishing between values above and below a threshold. Defaults to
0.If
EnforcedNullType, the columns extend from the padding Y axis minimum.- Return type:
numeric or
EnforcedNullTypeorNone
- property tooltip: Tooltip | None
A configuration object for the tooltip rendering of each single series. Properties are inherited from tooltip, but only the following properties can be defined on a series level.
- Return type:
TooltiporNone
- property turbo_threshold: int | None
When a series contains a data array longer than this value, only one dimensional arrays of numbers, or two dimensional arrays with x and y values are allowed. Also, only the first point is tested, and the rest are assumed to be the same format. This saves expensive data checking and indexing in long series. Set it to
0orNoneto disable.Defaults to
1000.Note
In boost mode, turbo threshold is forced. Only array of numbers or two dimensional arrays are allowed.
- property type: str
Indicates the type of series that is represented by this instance.
Warning
This proprety is read-only!
- Return type:
- property visible: bool | None
If
True, the series is initially visible. IfFalse, the series is hidden by default. Defaults toTrue.
- property wrap: bool | None
When
True, the dial will wrap around the axes. When wrap isFalse, the dial stops at 360. Defaults toTrue.For instance, if
Truein a full-range gauge going from0to360, a value of400will point to40.
- property x_axis: str | int | None
When using multiple X-axes, this setting determines on which axis the series should be drawn. Its value should be either a numerical index position in the
Options.x_axis()array (starting at 0), or astrindicating theidof the axis to which the series should be connected. Defaults toNone, which behaves as if the value were set to0.
- property y_axis: str | int | None
When using multiple Y-axes, this setting determines on which axis the series should be drawn. Its value should be either a numerical index position in the
Options.y_axis()array (starting at 0), or astrindicating theidof the axis to which the series should be connected. Defaults toNone, which behaves as if the value were set to0.
- property z_index: int | float | Decimal | None
The visual z-index of the series. Defaults to
None.- Return type:
numeric or
None
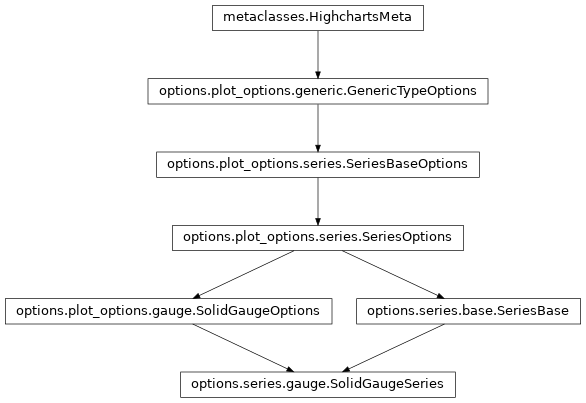
class: SolidGaugeSeries
- class SolidGaugeSeries(**kwargs)[source]
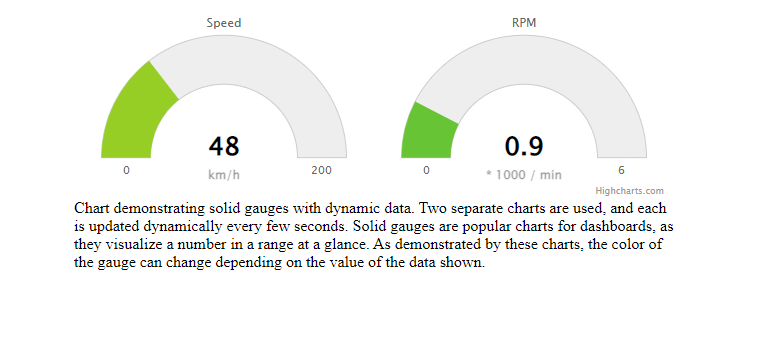
Options to configure a Solid Gauge series.
A solid gauge is a circular gauge where the value is indicated by a filled arc, and the color of the arc may variate with the value.
Class Inheritance
- copy(other=None, overwrite=True, **kwargs)
Copy the configuration settings from this instance to the
otherinstance.- Parameters:
other (
HighchartsMeta) – The target instance to which the properties of this instance should be copied. IfNone, will create a new instance and populate it with properties copied fromself. Defaults toNone.overwrite (
bool) – ifTrue, properties inotherthat are already set will be overwritten by their counterparts inself. Defaults toTrue.kwargs – Additional keyword arguments. Some special descendents of
HighchartsMetamay have special implementations of this method which rely on additional keyword arguments.
- Returns:
A mutated version of
otherwith new property values
- classmethod from_csv(as_string_or_file, property_column_map, has_header_row=True, series_kwargs=None, delimiter=',', null_text='None', wrapper_character="'", line_terminator='\r\n', wrap_all_strings=False, double_wrapper_character_when_nested=False, escape_character='\\')
Create a new series instance with a
.dataproperty populated from data in a CSV string or file.Note
For an example
LineSeries, the minimum code required would be:my_series = LineSeries.from_csv('some-csv-file.csv', property_column_map = { 'x': 0, 'y': 3, 'id': 'id' })
As the example above shows, data is loaded into the
my_seriesinstance from the CSV file with a filenamesome-csv-file.csv. Thexvalues for each data point will be taken from the first (index 0) column in the CSV file. Theyvalues will be taken from the fourth (index 3) column in the CSV file. And theidvalues will be taken from a column whose header row is labeled'id'(regardless of its index).- Parameters:
as_string_or_file (
stror Path-like) –The CSV data to use to pouplate data. Accepts either the raw CSV data as a
stror a path to a file in the runtime environment that contains the CSV data.Tip
Unwrapped empty column values are automatically interpreted as null (
None).property_column_map (
dict) –A
dictused to indicate which data point property should be set to which CSV column. The keys in thedictshould correspond to properties in the data point class, while the value can either be a numerical index (starting with 0) or astrindicating the label for the CSV column.has_header_row (
bool) – IfTrue, indicates that the first row ofas_string_or_filecontains column labels, rather than actual data. Defaults toTrue.series_kwargs (
dict) –An optional
dictcontaining keyword arguments that should be used when instantiating the series instance. Defaults toNone.Warning
If
series_kwargscontains adatakey, its value will be overwritten. Thedatavalue will be created from the CSV file instead.delimiter (
str) – The delimiter used between columns. Defaults to,.wrapper_character (
str) – The string used to wrap string values when wrapping is applied. Defaults to'.null_text (
str) – The string used to indicate an empty value if empty values are wrapped. Defaults to None.line_terminator (
str) – The string used to indicate the end of a line/record in the CSV data. Defaults to'\r\n'.line_terminator –
The string used to indicate the end of a line/record in the CSV data. Defaults to
'\r\n'.Note
The Python
csvcurrently ignores theline_terminatorparameter and always applies'\r\n', by design. The Python docs say this may change in the future, so for future backwards compatibility we are including it here.wrap_all_strings (
bool) –If
True, indicates that the CSV file has all string data values wrapped in quotation marks. Defaults toFalse.double_wrapper_character_when_nested (
bool) – IfTrue, quote character is doubled when appearing within a string value. IfFalse, theescape_characteris used to prefix quotation marks. Defaults toFalse.escape_character (
str) – A one-character string that indicates the character used to escape quotation marks if they appear within a string value that is already wrapped in quotation marks. Defaults to\\(which is Python for'\', which is Python’s native escape character).
- Returns:
A series instance (descended from
SeriesBase) with its.dataproperty populated from the CSV data inas_string_or_file.- Return type:
listof series instances (descended fromSeriesBase)- Raises:
HighchartsCSVDeserializationError – if
property_column_mapreferences CSV columns by their label, but the CSV data does not contain a header row
- classmethod from_dict(as_dict: dict, allow_snake_case: bool = True)
Construct an instance of the class from a
dictobject.
- classmethod from_js_literal(as_str_or_file, allow_snake_case: bool = True, _break_loop_on_failure: bool = False)
Return a Python object representation of a Highcharts JavaScript object literal.
- Parameters:
as_str_or_file (
str) – The JavaScript object literal, represented either as astror as a filename which contains the JS object literal.allow_snake_case (
bool) – IfTrue, interpretssnake_casekeys as equivalent tocamelCasekeys. Defaults toTrue._break_loop_on_failure (
bool) – IfTrue, will break any looping operations in the event of a failure. Otherwise, will attempt to repair the failure. Defaults toFalse.
- Returns:
A Python object representation of the Highcharts JavaScript object literal.
- Return type:
HighchartsMeta
- classmethod from_json(as_json_or_file, allow_snake_case: bool = True)
Construct an instance of the class from a JSON string.
- Parameters:
as_json_or_file – The JSON string for the object or the filename of a file that contains the JSON string.
allow_snake_case (
bool) – IfTrue, interpretssnake_casekeys as equivalent tocamelCasekeys. Defaults toTrue.
- Returns:
A Python objcet representation of
as_json.- Return type:
HighchartsMeta
- classmethod from_pandas(df, property_map, series_kwargs=None)
Create a series instance whose
.dataproperty is populated from a pandasDataFrame.- Parameters:
df (
DataFrame) – TheDataFramefrom which data should be loaded.property_map (
dict) – Adictused to indicate which data point property should be set to which column indf. The keys in thedictshould correspond to properties in the data point class, while the value should indicate the label for theDataFramecolumn.series_kwargs (
dict) –An optional
dictcontaining keyword arguments that should be used when instantiating the series instance. Defaults toNone.Warning
If
series_kwargscontains adatakey, its value will be overwritten. Thedatavalue will be created fromdfinstead.
- Returns:
A series instance (descended from
SeriesBase) with its.dataproperty populated from the data indf.- Return type:
listof series instances (descended fromSeriesBase)- Raises:
HighchartsPandasDeserializationError – if
property_mapreferences a column that does not exist in the data frameif pandas is not available in the runtime environment
- classmethod from_pyspark(df, property_map, series_kwargs=None)
Create a series instance whose
.dataproperty is populated from a PySparkDataFrame.- Parameters:
df (
DataFrame) – TheDataFramefrom which data should be loaded.property_map (
dict) – Adictused to indicate which data point property should be set to which column indf. The keys in thedictshould correspond to properties in the data point class, while the value should indicate the label for theDataFramecolumn.series_kwargs (
dict) –An optional
dictcontaining keyword arguments that should be used when instantiating the series instance. Defaults toNone.Warning
If
series_kwargscontains adatakey, its value will be overwritten. Thedatavalue will be created fromdfinstead.
- Returns:
A series instance (descended from
SeriesBase) with its.dataproperty populated from the data indf.- Return type:
listof series instances (descended fromSeriesBase)- Raises:
HighchartsPySparkDeserializationError – if
property_mapreferences a column that does not exist in the data frameif PySpark is not available in the runtime environment
- load_from_csv(as_string_or_file, property_column_map, has_header_row=True, delimiter=',', null_text='None', wrapper_character="'", line_terminator='\r\n', wrap_all_strings=False, double_wrapper_character_when_nested=False, escape_character='\\')
Replace the existing
.dataproperty with a new value populated from data in a CSV string or file.Note
For an example
LineSeries, the minimum code required would be:my_series = LineSeries() my_series = my_series.from_csv('some-csv-file.csv', property_column_map = { 'x': 0, 'y': 3, 'id': 'id' })
As the example above shows, data is loaded into the
my_seriesinstance from the CSV file with a filenamesome-csv-file.csv. Thexvalues for each data point will be taken from the first (index 0) column in the CSV file. Theyvalues will be taken from the fourth (index 3) column in the CSV file. And theidvalues will be taken from a column whose header row is labeled'id'(regardless of its index).- Parameters:
as_string_or_file (
stror Path-like) –The CSV data to use to pouplate data. Accepts either the raw CSV data as a
stror a path to a file in the runtime environment that contains the CSV data.Tip
Unwrapped empty column values are automatically interpreted as null (
None).property_column_map (
dict) –A
dictused to indicate which data point property should be set to which CSV column. The keys in thedictshould correspond to properties in the data point class, while the value can either be a numerical index (starting with 0) or astrindicating the label for the CSV column.has_header_row (
bool) – IfTrue, indicates that the first row ofas_string_or_filecontains column labels, rather than actual data. Defaults toTrue.delimiter (
str) – The delimiter used between columns. Defaults to,.wrapper_character (
str) – The string used to wrap string values when wrapping is applied. Defaults to'.null_text (
str) – The string used to indicate an empty value if empty values are wrapped. Defaults to None.line_terminator (
str) – The string used to indicate the end of a line/record in the CSV data. Defaults to'\r\n'.line_terminator –
The string used to indicate the end of a line/record in the CSV data. Defaults to
'\r\n'.Note
The Python
csvcurrently ignores theline_terminatorparameter and always applies'\r\n', by design. The Python docs say this may change in the future, so for future backwards compatibility we are including it here.wrap_all_strings (
bool) –If
True, indicates that the CSV file has all string data values wrapped in quotation marks. Defaults toFalse.double_wrapper_character_when_nested (
bool) – IfTrue, quote character is doubled when appearing within a string value. IfFalse, theescape_characteris used to prefix quotation marks. Defaults toFalse.escape_character (
str) – A one-character string that indicates the character used to escape quotation marks if they appear within a string value that is already wrapped in quotation marks. Defaults to\(which is Python for'', which is Python’s native escape character).
- Raises:
HighchartsCSVDeserializationError – if
property_column_mapreferences CSV columns by their label, but the CSV data does not contain a header row
- load_from_pandas(df, property_map)
Replace the contents of the
.dataproperty with data points populated from a pandasDataFrame.- Parameters:
df (
DataFrame) – TheDataFramefrom which data should be loaded.property_map (
dict) – Adictused to indicate which data point property should be set to which column indf. The keys in thedictshould correspond to properties in the data point class, while the value should indicate the label for theDataFramecolumn.
- Raises:
HighchartsPandasDeserializationError – if
property_mapreferences a column that does not exist in the data frameif pandas is not available in the runtime environment
- load_from_pyspark(df, property_map)
Replaces the contents of the
.dataproperty with values from a PySparkDataFrame.- Parameters:
df (
DataFrame) – TheDataFramefrom which data should be loaded.property_map (
dict) – Adictused to indicate which data point property should be set to which column indf. The keys in thedictshould correspond to properties in the data point class, while the value should indicate the label for theDataFramecolumn.
- Raises:
HighchartsPySparkDeserializationError – if
property_mapreferences a column that does not exist in the data frameif PySpark is not available in the runtime environment
- to_dict() dict
Generate a
dictrepresentation of the object compatible with the Highcharts JavaScript library.Note
The
dictrepresentation has a property structure and naming convention that is intentionally consistent with the Highcharts JavaScript library. This is not Pythonic, but it makes managing the interplay between the two languages much, much simpler.
- to_js_literal(filename=None, encoding='utf-8') str | None
Return the object represented as a
strcontaining the JavaScript object literal.
- to_json(filename=None, encoding='utf-8')
Generate a JSON string/byte string representation of the object compatible with the Highcharts JavaScript library.
Note
This method will either return a standard
stror abytesobject depending on the JSON serialization library you are using. For example, if your environment has orjson, the result will be abytesrepresentation of the string.- Parameters:
- Returns:
A JSON representation of the object compatible with the Highcharts library.
- Return type:
- static trim_dict(untrimmed: dict, to_json: bool = False) dict
Remove keys from
untrimmedwhose values areNoneand convert values that have.to_dict()methods.
- static trim_iterable(untrimmed, to_json=False)
Convert any
EnforcedNullTypevalues inuntrimmedto'null'.
- property accessibility: TypeOptionsAccessibility | None
Accessibility options for a series.
- Return type:
TypeOptionsAccessibilityorNone
- property allow_point_select: bool | None
Allow this series’ points to be selected by clicking on the graphic (columns, point markers, pie slices, map areas etc).
The selected points can be handled in JavaScript by point select and unselect events, or collectively by the (JavaScript)
getSelectedPoints()function.And alternative way of selecting points is through dragging.
Defaults to
False.
- property animation: AnimationOptions | None
Enable or disable the initial animation when a series is displayed.
The animation can also be set as a configuration object. Please note that this option only applies to the initial animation of the series itself. For other animations, see
Chart.animationand theanimationparameter under the (JavaScript) API methods. The following properties are supported:defer: The animation delay time in milliseconds.duration: The duration of the animation in milliseconds.easing: Can be a string reference to an easing function set on the Math object or a function.
Warning
Due to poor performance, animation is disabled in old IE browsers for several chart types.
- Return type:
AnimationOptionsorNone
- property animation_limit: int | float | Decimal | None
For some series, there is a limit that shuts down initial animation by default when the total number of points in the chart is too high. Defaults to
None.For example, for a column chart and its derivatives, animation does not run if there is more than 250 points totally. To disable this cap, set
animation_limittofloat("inf")(which represents infinity).- Return type:
numeric or
None
- property boost_threshold: int | None
Set the point threshold for when a series should enter boost mode. Defaults to
5000.Setting it to e.g. 2000 will cause the series to enter boost mode when there are 2,000 or more points in the series.
To disable boosting on the series, set the
boost_thresholdto0. Setting it to1will force boosting.Note
The
AreaOptions.crop_threshold()also affects this setting.When zooming in on a series that has fewer points than the
crop_threshold, all points are rendered although outside the visible plot area, and theboost_thresholdwon’t take effect.
- property class_name: str | None
The additional CSS class name to apply to the series’ graphical elements.
Note
This option is additive to the default class names - it does not replace them.
- property clip: bool | None
If
False, allows the series to be rendered in the entire plot area. IfTrue, constrains where the series can be rendered within the plot area. Defaults toTrue.
- property color: str | Gradient | Pattern | None
The main color of the series.
In line type series it applies to the line and the point markers unless otherwise specified. In bar type series it applies to the bars unless a color is specified per point. The default value is pulled from the
Options.colors()array.
- property color_axis: str | int | bool | None
When using dual or multiple color axes, this setting defines which color axis the particular series is connected to. It refers to either the
ColorAxis.id()or the index of the axis in theColorAxisarray, with0being the first. Set this option toFalseto prevent a series from connecting to the default color axis.Defaults to
0.
- property color_index: int | None
When operating in styled mode, a specific color index to use for the series, so that its graphic representations are given the class name
highcharts-color-{n}.Defaults to
None.
- property color_key: str | None
Determines what data value should be used to calculate point color if
AreaOptions.color_axis()is used.Note
Requires to set
minandmaxif some custom point property is used or if approximation for data grouping is set to'sum'.
- property connect_ends: bool | None
If
True, connect the ends of a line series plot across the extremes. Defaults toNone.Warning
Applies to polar charts only.
- property connect_nulls: bool | None
If
True, connect a graph line across null points. IfFalse, renders a gap between the points on either side of the null point. Defaults toFalse.
- property crisp: bool | None
If
True, each point or column edge is rounded to its nearest pixel in order to render sharp on screen. Defaults toTrue.Hint
In some cases, when there are a lot of densely packed columns, this leads to visible difference in column widths or distance between columns. In these cases, setting
crisptoFalsemay look better, even though each column is rendered blurry.
- property crop_threshold: int | None
When the series contains less points than the crop threshold, all points are drawn, even if the points fall outside the visible plot area at the current zoom. Defaults to
300.The advantage of drawing all points (including markers and columns), is that animation is performed on updates. On the other hand, when the series contains more points than the crop threshold, the series data is cropped to only contain points that fall within the plot area. The advantage of cropping away invisible points is to increase performance on large series.
- property cursor: str | None
The style of cursor to use when the user’s mouse hovers over the data series.
Acceptable values are:
'alias''all-scroll''auto''cell''col-resize''context-menu''copy''crosshair''default''e-resize''ew-resize''grab''grabbing''help''move''n-resize''ne-resize''nesw-resize''no-drop''none''not-allowed''ns-resize''nw-resize''nwse-resize''pointer''progress''row-resize''s-resize''se-resize''sw-resize''text''vertical-text''w-resize''wait''zoom-in''zoom-out'
- property custom: JavaScriptDict | None
A reserved subspace to store options and values for customized functionality.
Here you can add additional data for your own event callbacks and formatter callbacks.
- property dash_style: str | None
Name of the dash style to use for the graph, or for some series types the outline of each shape.
Accepts one of the following values:
‘Dash’,
‘DashDot’,
‘Dot’,
‘LongDash’,
‘LongDashDot’,
‘LongDashDotDot’,
‘ShortDash’,
‘ShortDashDot’,
‘ShortDashDotDot’,
‘ShortDot’,
‘Solid’
- property data: List[SinglePointData] | None
Collection of data that represents the series. Defaults to
None.While the series type returns a collection of
SinglePointDatainstances, it accepts as input three different types of data:series = PieSeries() series.data = [0, 5, 3, 5]
A one-dimensional collection of numerical values. Each member of the collection will be interpreted as a
yvalueA one-dimensional collection of
SinglePointDataobjects.
- property data_labels: DataLabel | List[DataLabel] | None
Options for the series data labels, appearing next to each data point.
Note
To have multiple data labels per data point, you can also supply a collection of
DataLabelconfiguration settings.
- property data_sorting: DataSorting | None
Options for the series data sorting.
- Return type:
DataSortingorNone
- property description: str | None
A description of the series to add to the screen reader information about the series.
- property drag_drop: DragDropOptions | None
The draggable-points module allows points to be moved around or modified in the chart.
In addition to the options mentioned under the dragDrop API structure, the module fires three (JavaScript) events:
point.dragStartpoint.dragpoint.drop
- Return type:
DragDropOptionsorNone
- property enable_mouse_tracking: bool | None
If
True, enables mouse tracking for the series (used to capture point tooltips, click events on graphs and points, etc.). IfFalse, disables mouse tracking for the series (which can help performance). Defaults toTrue.
- property events: SeriesEvents | None
General event handlers for the series items.
Note
These event hooks can also be attached to the series at run time using the (JavaScript)
Highcharts.addEvent()function.- Return type:
SeriesEventsorNone
- property find_nearest_point_by: str | None
Determines whether the series should look for the nearest point in both dimensions or just the x-dimension when hovering the series.
If
None, defaults to'xy'for scatter series and'x'for most other series. If the data has duplicate x-values, it is recommended to set this to'xy'to allow hovering over all points.Applies only to series types using nearest neighbor search (not direct hover) for tooltip.
- property get_extremes_from_all: bool | None
If
True, uses the Y extremes of the total chart width or only the zoomed area when zooming in on parts of the X axis. By default, the Y axis adjusts to the min and max of the visible data.Warning
Applies to Cartesian series only.
- property id: str | None
An id for the series. Defaults to
None.Hint
This can be used (in JavaScript) after render time to get a pointer to the series object through
chart.get().
- property include_in_data_export: bool | None
If
False, will prevent the data series from being included in any form of data export. Defaults toTrue.
- property index: int | None
The index for the series in the chart, affecting the internal index in the (JavaScript)
chart.seriesarray, the visible Z-index, and the order of the series in the legend. Defaults toNone.
- property inner_radius: str | int | float | Decimal | None
The inner radius for points in a solid gauge. Can be given as a number (pixels) or percentage string. Defaults to
60.
- property keys: List[str] | None
An array specifying which option maps to which key in the data point array.
This makes it convenient to work with unstructured data arrays from different sources.
- property label: SeriesLabel | None
Series labels are placed as close to the series as possible in a natural way, seeking to avoid other series. The goal of this feature is to make the chart more easily readable, like if a human designer placed the labels in the optimal position.
Note
The series labels currently work with series types having a graph or an area.
- Return type:
SeriesLabelorNone
- property legend_index: int | None
The sequential index for the series in the legend. Defaults to
None.
- property line_width: int | float | Decimal | None
Pixel width of the graph line. Defaults to
2.- Return type:
numeric or
None
- property linecap: str | None
The SVG value used for the
stroke-linecapandstroke-linejoinof a line graph. Defaults to'round', which means that lines are rounded in the ends and bends.
- property linked_to: str | None
The id of another series to link to.
Hint
The value can be
':previous'to link to the previous series. When two series are linked, only the first one appears in the legend. Toggling the visibility of this also toggles the linked series.Note
If the master series uses data sorting and linked series does not have its own sorting definition, the linked series will be sorted in the same order as the master one.
- property marker: Marker | None
Options for the point markers of line-like series.
Properties like
fill_color,line_colorandline_widthdefine the visual appearance of the markers. Other series types, like column series, don’t have markers, but have visual options on the series level instead.- Return type:
MarkerorNone
- property name: str | None
The name of the series as shown in the legend, tooltip, etc. Defaults to
None.
- property negative_color: str | Gradient | Pattern | None
The color for the parts of the graph or points that are below the
AreaOptions.threshold().Note
Zonestake precedence over the negative color. Usingnegative_coloris equivalent to applying a zone with value of 0.
- property on_point: OnPointOptions | None
Options for the Series on point feature, which is currently only supported by
pieandsunburstchargs.- Return type:
OnPointOptionsorNone
- property opacity: float | None
Opacity of a series parts: line, fill (e.g. area), and labels.
- Return type:
- property overshoot: int | float | Decimal | None
Allow the dial to overshoot the end of the perimeter axis by this many degrees.
For example, if this option is set to
5and the gauge axis goes from0to60, a value of100, or1000, will show5degrees beyond the end of the axis.Defaults to
0.- Return type:
numeric or
None
- property point_description_formatter: CallbackFunction | None
Same as for
Accessibility.series.description_formatter(), only for an individual series. Overrides the chart-wide configuration.- Return type:
CallbackFunctionorNone
- property point_interval: int | float | Decimal | None
If no x values are given for the points in a series,
point_intervaldefines the interval of the x values. Defaults to1.For example, if a series contains one value every decade starting from year 0, set
point_intervalto10. In true datetime axes, thepoint_intervalis set in milliseconds.Hint
point_intervalcan be also be combined withpoint_interval_unitto draw irregular time intervals.Note
If combined with
relative_x_value, an x value can be set on each point, and thepoint_intervalis added x times to thepoint_startsetting.Warning
This options applies to the series data, not the interval of the axis ticks, which is independent.
- Return type:
numeric or
None
- property point_interval_unit: str | None
On datetime series, this allows for setting the
point_intervalto irregular time units, day, month, and year.A day is usually the same as 24 hours, but
point_interval_unitalso takes the DST crossover into consideration when dealing with local time.Combine this option with
point_intervalto draw weeks, quarters, 6 month periods, 10 year periods, etc.Warning
This options applies to the series data, not the interval of the axis ticks, which is independent.
- property point_placement: str | int | float | Decimal | None
Used to determine the placement of the point in relation to tick marks on the X axis. Defaults to
None, which behaves as undefined in cartesian charts, and"between"in polar charts.Accepts possible values:
'on'- where the point will not create any padding of the X axis. In a polar column chart this means that the first column points directly north."between"- where the columns will be laid out between ticks. This is useful for example for visualising an amount between two points in time or in a certain sector of a polar chart.a numeric value - where
0is on the axis value,-0.5is between this value and the previous, and0.5is between this value and the next. Unlike the textual options, numeric point placement options won’t affect axis padding.
Warning
Requires
point_rangeto work. For column series this is computed, but for line-type series it needs to be set.Note
For the xrange series type and gantt charts, if the Y axis is a category axis, the
point_placementapplies to the Y axis rather than the (typically datetime) X axis.
- property point_start: int | float | Decimal | None
If no x values are given for the points in a series,
point_startdefines on what value to start. For example, if a series contains one yearly value starting from 1945, setpoint_startto1945. Defaults to0.Note
If combined with
relative_x_value, an x value can be set on each point. The x value from the point options is multiplied bypoint_intervaland added topoint_startto produce a modified x value.- Return type:
numeric or
None
- property radius: str | int | float | Decimal | None
The outer radius for points in a solid gauge. Can be given as a number (pixels) or percentage string. Defaults to
100.
- property relative_x_value: bool | None
When
True, X values in the data set are relative to the currentpoint_start,point_interval, andpoint_interval_unitsettings. This allows compression of the data for datasets with irregular X values. Defaults toFalse.The real X values are computed on the formula
f(x) = ax + b, whereais thepoint_interval(optionally with a time unit given bypoint_interval_unit), andbis thepoint_start.
- property selected: bool | None
If
True, the series is selected initially (by default, without user interaction). Defaults toFalse.Note
If
GenericTypeOptions.show_checkbox()isTrue, then the checkbox will be checked ifselectedisTrue.
- property shadow: bool | ShadowOptions | None
Configuration for the shadow to apply to the tooltip. Defaults to
False.If
False, no shadow is applied.- Returns:
The shadow configuration to apply or a boolean setting which hides the shadow or displays the default shadow.
- Return type:
boolorShadowOptions
- property show_checkbox: bool | None
If
True, a checkbox is displayed next to the legend item to allow selecting the series.Note
The state of the checkbox is controlled by the
GenericTypeOptions.selected()property.
- property show_in_legend: bool | None
Whether to display this particular series or series type in the legend. Standalone series are shown in the legend by default, and linked series are not.
If
True, the accessibility module will skip past this series when executing keyboard navigation.
- property soft_threshold: bool | None
When
True, the series will not cause the Y axis to cross the zero plane (or threshold option) unless the data actually crosses the plane. Defaults toTrue.For example, if
False, a series of0, 1, 2, 3will make the Y axis show negative values according to themin_padidngoption. IfTrue, the Y axis starts at 0.- Return type:
- property stack: str | None
Indicates the “stack” into which the series should be grouped, if the chart groups series into stacks. Defaults to
None.Note
The value can be a string or a numeric value, provided that series in the same stack all have the same value when converted to a string. For ease of ues, Highcharts for Python will attempt to force the conversion of the relevant value to a string.
- property stacking: str | None
Whether to stack the values of each series on top of each other. Defaults to
None.Acceptable values are:
Noneto disable stacking,"normal"to stack by value or"percent"'stream'(for streamgraph series type only)'overlap'(for waterfall series type only)
Note
When stacking is enabled, data must be sorted in ascending X order.
- property states: States | None
Configuration for state-specific configuration to apply to the data series.
- Return type:
StatesorNone
- property step: str | None
Whether to apply steps to the line. Defaults to
None.Possible values are:
'left''center''right'
- property sticky_tracking: bool | None
Sticky tracking of mouse events.
When
True, the (JavaScript)mouseOutevent on a series is not triggered until the mouse moves over another series, or out of the plot area.When
False, the (JavaScript)mouseOutevent on a series is triggered when the mouse leaves the area around the series’ graph or markers. This also implies the tooltip when not shared.When
FalseandPlotOptions.tooltip.shared()is alsoFalse, the tooltip will be hidden when moving the mouse between series.Defaults to
Truefor line and area type series, but toFalsefor columns, pies, etc.Note
The boost module will force this option because of technical limitations.
- property threshold: int | float | Decimal | EnforcedNullType | None
The Y axis value to serve as the base for the columns, for distinguishing between values above and below a threshold. Defaults to
0.If
EnforcedNullType, the columns extend from the padding Y axis minimum.- Return type:
numeric or
EnforcedNullTypeorNone
- property tooltip: Tooltip | None
A configuration object for the tooltip rendering of each single series. Properties are inherited from tooltip, but only the following properties can be defined on a series level.
- Return type:
TooltiporNone
- property turbo_threshold: int | None
When a series contains a data array longer than this value, only one dimensional arrays of numbers, or two dimensional arrays with x and y values are allowed. Also, only the first point is tested, and the rest are assumed to be the same format. This saves expensive data checking and indexing in long series. Set it to
0orNoneto disable.Defaults to
1000.Note
In boost mode, turbo threshold is forced. Only array of numbers or two dimensional arrays are allowed.
- property type: str
Indicates the type of series that is represented by this instance.
Warning
This proprety is read-only!
- Return type:
- property visible: bool | None
If
True, the series is initially visible. IfFalse, the series is hidden by default. Defaults toTrue.
- property x_axis: str | int | None
When using multiple X-axes, this setting determines on which axis the series should be drawn. Its value should be either a numerical index position in the
Options.x_axis()array (starting at 0), or astrindicating theidof the axis to which the series should be connected. Defaults toNone, which behaves as if the value were set to0.
- property y_axis: str | int | None
When using multiple Y-axes, this setting determines on which axis the series should be drawn. Its value should be either a numerical index position in the
Options.y_axis()array (starting at 0), or astrindicating theidof the axis to which the series should be connected. Defaults toNone, which behaves as if the value were set to0.
- property z_index: int | float | Decimal | None
The visual z-index of the series. Defaults to
None.- Return type:
numeric or
None